Tag: Transportation

  • The Future of Passenger Rail in America

    On October 19, an Amtrak passenger train hit 111 mph in a test run on a 15-mile stretch of track between Dwight and Pontiac, Illinois. It was the first tangible return from a three-year $1.5 billion program of improvements funded under the Administration’s high-speed rail initiative. The program hopes to shave about an hour off the 5 ½ hour rail trip between Chicago and St. Louis. Transportation Secretary Ray LaHood and Illinois Gov. Pat Quinn who were aboard, called it a "historic" event. They were perhaps unaware, as Chicago SunTimes respected columnist Mark Brown pointed out, that "ten years ago, also on the eve of an election, the same Illinois Department of Transportation offered another demonstration along nearly the same stretch of track, also reaching 110 mph."

    Setting this pre-election rhetoric aside, of President Obama’s vaunted HSR initiative that promised to connect 80 percent of Americans with high-speed rail, only two true high-speed rail projects remain.  They are the California SF-to-LA Bullet Train and the "Amtrak Vision for the Northeast Corridor." The future of these two projects is discussed below. A condensed version of this commentary appeared in the Wall Street Journal on September 24, 2012.

    ### 

    High speed trains are hardly new — they have been crisscrossing France and Japan for over 40 years. But building a nationwide high-speed rail network in America is quite a novel idea. It originated with President Obama who, on April 16, 2009, announced a plan "to give 80 percent of Americans access to high-speed rail within the next 25 years." The program was seeded with an $8 billion grant from the American Recovery and Reinvestment Act of 2009 (ARRA), later supplemented with an additional $2.1 billion in general funds.

    But this lofty and extravagant vision soon yielded to practical realities. One such reality is America’s demography. Unlike Western Europe and Japan, the United States, lacks an urban pattern that favors high-speed rail connections. This pattern requires large traffic generating city-pairs that are neither close enough to each other to favor travel by car nor far enough apart to favor travel by air. In Europe and Japan those distances happen to fall in the range of 200-400 miles (Think Paris-Lyon, 290 miles; or Tokyo-Nagoya, 220 miles). The only corridor in the United States that fits this description is the Northeast Corridor. No wonder, the Boston-to-Washington rail line has lately become a focus of high-speed rail planning.

    Another reality is that true high-speed rail service requires a dedicated alignment reserved exclusively for passenger trains. Such is the case with the French TGV, the German ICE and the Japanese Shinkansen trains— as indeed, with any train that runs at top speeds of 150 miles per hour or higher. Having high-speed trains share a common track with lumbering freight trains as the Obama Administration has proposed to do, is to invite serious operational conflicts and safety problems. But dedicated rights-of-way for high speed trains require relatively straight and level alignments with minimal curvature. To assemble such rights-of-way in densely populated corridors where land holdings are highly fragmented, would be extremely costly and disruptive if not totally impossible.

    Yet another reality is the uncertain prospect for further federal support. Such support is deemed essential for the future of the Administration’s HSR program (but not for the future of privately funded ventures such as the proposed Lone Star HSR line between Dallas and Houston). Congress, by denying White House requests for high-speed rail funds three years in a row, has sent a clear bipartisan signal that states should not count on continued congressional appropriations for high-speed rail. The lawmakers reaffirmed this intention by eliminating Title V of the Senate transportation bill (the National Rail System Preservation, Expansion and Development Act of 2012) from the final version of the surface transportation reauthorization (MAP-21). In the meantime, the $10.1 billion earmarked for high-speed rail has been fully committed.

    In sum, high-speed rail advocates, promoters and dreamers need a triple reality check.

    Improving Existing Rail Service

    But this is not to say that nothing should be done to improve and expand existing passenger rail services, especially commuter rail lines serving major metropolitan areas. Even though such improvements will not result in significant travel time savings, they could lead to more efficient, frequent and reliable transportation service benefitting millions of daily commuters. In 2010, commuter rail systems across the country provided service to nearly 460 million riders.

    Improving commuter rail services is indeed, the approach embraced by the California High Speed Rail Authority. Despite its avowed goal to link LA and San Francisco with high-speed trains, almost half of its initial $10 billion first stage of the project will be devoted to upgrading conventional transit and commuter rail services in Los Angeles and the Bay Area, the "bookends" of the high-speed rail line, e.g. through electrification of the SF-to-San Jose Caltrain and "connectivity" improvements in LA’s Metrolink.

    The dollars spent on commuter rail improvements will have "an immediate and dramatic effect" according to the Authority’s chairman, Dan Richard. Will Kempton, chief executive of the Orange County Transportation Authority (OCTA) and chairman of the Independent Peer Review Group advising the High Speed Rail Authority concurs. It will be a good investment, he said, whether or not the overall $68 billion high-speed rail project ever gets completed.

    Similarly, in the Northeast Corridor where Amtrak has proposed a 30-year $151 billion capital investment program to bring true high-speed rail service between Boston and Washington DC, the initial efforts will be focused on "meaningful incremental improvements" in track, catenary and signals in the New York-to-Philadelphia corridor (the "NEC Upgrade Program"). This stretch of the line was chosen for the initial upgrade because it carries a heavy volume of local commuter traffic in addition to serving long distance trains. As in the case of California’s "bookend" improvements, the upgrades of the 90-mile NY-Philadelphia rail line will not only benefit large numbers of travelers – they also will be far more cost-effective in dollars-per-passenger terms than any eventual improvements raising line speeds over the entire Boston-to-Washington corridor.

    Thus, fiscal, economic and political constraints have caused both the California Bullet Train and the Amtrak vision for the Northeast Corridor — the only two projects that have survived on the Obama Administration’s vaunted high-speed rail agenda — to morph largely into a program of modest near-term improvements in existing commuter rail services. Lack of funds may prevent either project from achieving its avowed goal of providing true high-speed rail service— in the case of California, reducing travel time between LA and San Francisco to two hours and forty minutes (see Note below).  To achieve it, the California project will require $68 billion; the NEC program will need $151 billion.

    Is this goal even worth pursuing? Some people think so—in fact they passionately believe in it. They contend that in order to make our cities less auto-dependent we need to invest in high-speed trains. Minor upgrades in existing rail services, they argue, will not make a significant dent in auto use. But many planners beg to differ. They believe that the best chance of persuading current auto users to leave their cars at home is to improve the daily suburban rail commute. Business travelers will continue flying because they look for the fastest way to get to their destination. Families on vacation trips will not abandon their cars in favor of trains because cars offer the least costly and most convenient way to travel to holiday destinations. The only sector of the traveling public that can be influenced to shift to trains in large numbers are suburban commuters.

    What of the argument that a great nation like ours—a nation that built the Erie Canal, the transcontinental railroad, the Panama Canal and the Interstate Highway System — should continue the tradition of visionary grandiose public works.

    Regretfully, both ventures have come at a most inopportune time. The nation is recovering from a serious recession and is trying to rein in the deficit and reduce the 16 trillion dollar national debt. At a more distant moment in time, when the economy is growing again and the deficit has come under control, the nation might be able to resume its tradition of pursuing "bold endeavors"—ambitious programs of federally financed public works that benefit the whole nation. When that time comes, perhaps toward the end of this decade, it might be appropriate to revive the idea of high-speed rail— at least in the context of the densely populated Northeast Corridor where road and air traffic congestion may eventually threaten its continued growth and productivity. For now, prudence, good sense and the nation’s fiscal well-being require that we lower our sights and focus on improving commuter rail connections.

    ###

    Note on the Status of the California HSR Project

    There is a high likelihood that the LA-SF bullet train project will never get completed. Law suits are pending to stop construction of the first stage of the project—the Central Valley segment from Madera to Bakersfield. A motion for a preliminary injunction has been filed by Madera County, the Madera and Merced County farm bureaus and other opponents. The motion seeks to prevent the rail Authority from moving forward on the initial Madera-to-Fresno section until a trial on the lawsuit is completed. Hearing on the preliminary injunction is set for November 16.

    Even if the preliminary injunction is denied, construction on the rail section will not begin until the fall of 2013 according to a legal declaration filed by the Authority in the Sacramento Superior Court. What’s more, the Madera-to-Fresno section will not be electrified before 2022 according to the rail Authority—and then only if more funds become available. Additional legal challenges are expected over the Fresno-to-Bakersfield section of the line. The City of Bakersfield has already announced plans to file a lawsuit contending that the Authority’s environmental impact report doesn’t meet CEQA standards. The cumulative effect of these delays has led to speculations that the Authority may not be able to complete work on the Central Valley segment by September 2017 when the federal $3 billion grant expires. And if the federal money stops flowing, who will step in to fill the gap?

  • As Partisan Rancor Rises, States That Back a Loser Will Be Punished

    Never mind the big-tent debate talk from both Barack Obama and Mitt Romney about how their respective politics will benefit all Americans. There’s a broader, ugly truth that as the last traces of purple fade from the electoral map, whoever wins will have little reason to take care of much of the country that rejected them.

     At least since the dissolving of the “solid South” in the late ’50s and early ’60s, both parties have competed to extend their reach to virtually every region. As recently as 1996, Democrat Bill Clinton could compete in the South, winning several states in the mid-South and even in the heart of Dixie, including Louisiana, Arkansas, Kentucky, and Tennessee. President Obama has about as much chance of winning these states this year as Abraham Lincoln did in 1860—giving him little reason to consider them in a second term.

    In the Clinton years, powerful Democrats hailed from what we now call red states not only in the South but also in the Great Plains. South Dakota’s Tom Daschle served as both Senate majority and minority leader, and Louisiana’s John Breaux and North Dakota’s Kent Conrad and Byron Dorgan were also players.

    After his 2008 win, Obama dismissed Republican objections to his stimulus with a two-word rejoinder: “I won.” But it’s become clear since that neither party is willing to accept the other’s claim of a popular mandate for its agenda. And the log jam  probably won’t be broken in November—especially if, as seems like the most likely outcome, Obama wins a second term while Republicans hold the House and edge closer to retaking the Senate.

    The 2010 Republican landslide was the rare election that radicalized both parties. The new GOP House majority was attained by adding Tea Partiers who have pushed the House—and to a lesser extent the Senate—rightward. At the same time, Democrats lost many of their remaining members who’d held on in Republican-leaning districts, leaving the party with a smaller but more ideologically pure cast of true believers in office.

    The right-leaning Blue Dog Democrats who once dominated the party’s ranks in the Plains and the Southeast are virtually extinct (as are Northeastern Republicans). In 2008 there were more than 50 Blue Dogs; the 2010 election sliced their ranks by half. After November there could be fewer than a dozen remaining. More and more Democrats, as Michael Barone has noted, come from overwhelmingly Democratic districts.

    A reelected President Obama may well find himself with almost no Plains or Southern Democrats in Congress outside of a few House members in Dixie’s handful of overwhelmingly African-American districts. With little reason to make compromise or common cause with solid red-state Republicans, the administration could leave the denizens of these states to bitterly cling to their guns and religion, while the president expands on his first-term practice of bypassing Congress to legislate by decree on everything from environmental policy to immigration and the implementation of health-care reform.  

    Already, notes National Journal’s Ron Brownstein, Democrats hold congressional majorities in only three noncoastal states—Iowa, New Mexico, and Vermont. Much of the country inside the coasts may find themselves with little sympathy from or access to a president whose reelection they will have rejected, often by lopsided double-digit margins.

    This could impact, in particular, energy policy since American fossil-fuel production is increasingly concentrated on the Plains, the rural Intermountain west and the Texas-Louisiana coast. Virtually all the mineral-rich economies excepting green-dominated California now lies well outside the electoral base of the president and his party. In a second Obama term, these states could well propel the national economy but could have little say on energy policies. Farming and ranching concerns will also have little political leverage with the White House. And traditional social concerns, most deeply felt in the Southern and more rural states, would lose all currency in a second-term administration whose worldview stems from that in big-city-dominated, deep-blue coastal states.

    The dissenting states with large fossil-fuel-driven economies—West Virginia, Texas, Oklahoma and North Dakota—would likely go to court to battle regulatory steps that they see as threatening large parts of their economies. In the Great Plains, expect a reprise of the 1970s Sagebrush Rebellion that bedeviled Jimmy Carter, as states fight back against green-oriented Washington regulators cracking down on users of federal land and water.

    Of course, if Romney finds a way to win, the coastal states would likely come in for some similarly rough treatment. The former Massachusetts governor has saved his harshest remarks for closed-door private events with big backers, dismissing 47 percent of the electorate as spongers at one such event, and telling backers at another that the Department of Education would become a “heck of a lot smaller” under his presidency and that the Department of Housing and Urban Development, which his father led during Richard Nixon’s first term in office, would face substantial cuts and “might not be around later.” The most devastating policy move he shared behind closed doors, though, was telling donors that he might eliminate the deductibility of state and local income and property taxes on federal returns—a move that would amount to a significant tax hike to many people living in high-tax and high-cost-of-living deep-blue states like New York and California.

    But since those states are solidly Democratic, Romney has little to lose politically by punishing or alienating their citizens.

    Deep-blue business interests could also lose their influence in a Romney administration, particularly if Republicans hold on to their strong majority in the House. The green-energy tax and subsidy farmers that have staked their future on the continued favor of the Democratic Party could find themselves cut off, and transit developers would also take a hit as the vast majority of train and bus riders come from a handful of dense and Democratic states (almost 40 percent of all national riders are in the New York area alone).

    But with Romney, the blue states would at least have a kind of patrician insurance, much as Clinton brought Southern sensibilities to the Democrats. The former Massachusetts governor is tied by a cultural and financial umbilical cord to his old comrades in the financial world of New York and Boston, making him less of a threat to the coastal ruling structures than Obama is to those of the interior states or the South.

    Whoever takes the White House, the nation’s best hope may be the regional mavericks who defy the trend toward geographical polarization. Democrats such as Sen. Jon Tester in Montana and Senate candidate Heidi Heitkamp in North Dakota are running hard against the anti-Obama tide in their states. Should they win, the party’s need to protect their seats would help press the White House to modify the party’s drift to an increasingly leftish social and environmental agenda.

    On the Republican side, the need to protect a middle-of-the-road politician like Massachusetts Sen. Scott Brown would push other party members into moderating their more extreme positions on social issues and regulation. Republican victories by Tommy Thompson in Wisconsin and Linda McMahon in Connecticut might also help moderate the party by adding to the numbers of “blue states” in the GOP caucus.

    For the federal union to work effectively, there has to be a sense that we are all, in different ways, linked to each other and share common interests that mean we’re willing to make compromises to live together. It’s time to bridge our partisan regional divides and avoid an ever more nasty, and divisive war between the states.

    Joel Kotkin is executive editor of NewGeography.com and is a distinguished presidential fellow in urban futures at Chapman University, and contributing editor to the City Journal in New York. He is author of The City: A Global History. His newest book is The Next Hundred Million: America in 2050, released in February, 2010.

    This piece originally appeared in The Daily Beast.

    State text map by Bigstock.

  • BBC Monster Traffic Jam List Includes Lexington, Kentucky? Really?

    The British Broadcasting Corporation (BBC) has just published a list of 10 "monster commutes" around the world. Some are to be expected, and are usually found on any list of extreme traffic congestion, such as Jakarta, Bangkok, Manila, Mumbai, Seoul, Nairobi and Dhaka.

    Lexington? However, reading further it becomes clearer that the BBC story deserves its own exhibit in the "Ripley’s Don’t Believe It" Room at the British Museum. BBC lists Lexington, Kentucky as one of 10 with "monster traffic jams." At first I thought BBC might have listed the wrong "L" place, having intended to cite Lagos or Lima instead. Not so, however since BBC quotes a Lexington commuter who claims to have spent an hour commuting to work one morning.

    That, surely is not the experience of the average Lexington resident. According to the United States Census Bureau, the average work trip travel time, one way, in the Lexington metropolitan area is 21 minutes. This compares to the US national average of approximately 25 minutes. Researchers David Hartgen and M. Gregory Fields estimated the excess travel time during peak hour in Lexington at five percent in 2003 (traffic congestion has not become serious enough to warrant the attention of the long-standing Texas Transportation Institute’s congestion reporting system). A quick review of data supplied by INRIX suggests that about 150 out of more than 180 rated US, European and Canadian metropolitan areas have worse traffic congestion than Lexington.

    Austin? Perhaps a stronger case can be made for the inclusion of Austin, Texas on the list. But even so, Austin barely makes the most congested quarter of the INRIX international list. Austin’s worse than average traffic congestion is the result of its late development an express roadway system, as this metropolitan area of the nearly 2,000,000 population was the last in the nation to connect two freeways together.

    BBC’s Austin commuter is quoted as indicating that he commutes by car, for which "I castigate myself daily." He continues: “I see two things that make me feel both guilty and shocked. A vacant city bus inching along my route and an empty tram cutting across traffic at 5pm." He misses the point. If the city bus is a vacant and the tram is empty, it is because they do not meet the needs of a sufficient number of customers (needs, which by the way can only be defined by consumers, not planners).

    The proof is the crowded buses and trains that converge on six large downtown areas in the United States, where 40 percent to 75 percent of commuters use transit. This is not because the people who work south of 59th Street in Manhattan, in Chicago’s Loop, or the downtown areas of Philadelphia, Washington, Boston or San Francisco have more effectively managed their guilt than the Austin commuter. It is rather because transit meets their needs. Commuters are rational. They take the mode of transport that best suits their needs. Transit’s market shares around the country (many of them miniscule) speak volumes about how well transit meets the needs of potential customers.

    Finally, BBC’s Austin commuter claims that it takes 45 minutes to drive three kilometers (2 miles) to work (walking would be as fast for most people). It is hard to imagine a more unrepresentative commute in Austin. According to the United States Census Bureau, the average one way commute in Austin in 2011 was 26 minutes. Somehow 85 percent of Austin commuters get to work in less time than the Austin commuter, and they travel a lot farther.

  • Chicago Tribune Joins the Ranks of High-speed Rail Critics

    Last year, in congressional testimony before the House Transportation and Infrastructure Committee hearing on high speed rail, we cited the Chicago-to-St.Louis "high-speed rail" project as an example of the Administration’s wasteful use of its economic stimulus money. We pointed out that the $1.4 billion program of track upgrades will allow top speed of 110 mph but will raise average speeds of Amtrak trains between Chicago and St. Louis by only 10 miles per hour, from 53 to 63 mph. The four-and-a-half hour trip time will be cut by a mere 48 minutes, to three hours and fourty minutes. In France, TGV trains between Paris and Lyon cover approximately the same ditance (290 miles) in a little under two hours, at an average speed of 150 mph. Yet, federal officials did not hesitate proclaiming the Chicago-St. Louis project as "historic" and hailing it as "one giant step closer to achieving high-speed rail passenger service."

    Now, a Chicago Tribune story, linked here and excerpted below, confirms just how "ridiculously expensive" and "uneconomical"  this project is turning out to be.  As the editorial points out, the project stands to "drain funding from mundane projects that could make a much bigger difference." Something that the California High Speed Rail Authority has belatedly recognized in diverting almost half of the initial $10 billion stage of its bullet train project to upgrading "mundane" commuter rail services in Los Angeles and the Bay Area. 

    In recent years, under the banner of economic stimulus, the federal government has spent a ton of money getting the tracks ready for those speedy locomotives. In the Chicago-St. Louis corridor, for instance, Uncle Sam has poured at least $1.4 billion into crossing improvements and other upgrades. Between Chicago and Detroit, more than $400 million has been spent.

    How would you feel, taxpayer, if we told you that some of the work might need to be torn up and redone?

    Angry? You bet.

    A debate over just how fast high-speed trains should operate could turn very costly very soon.

    The issue comes down to 15 miles per hour.

  • The Road Less Understood

    The Economist confuses ends (objectives) and means in its current number examining the peaking of per capita automobile use in the West in two articles ("The http://www.economist.com/node/21563327" and "Seeing the Back of the Car"). In congratulating metropolitan areas for trying "to change the way people move around," The Economist reminds that Portland (Oregon) has developed light rail and that policy supports transit in Los Angeles. So much for the means, but what about the ends?

    In Portland: Transit Loses Ground and a Skeptical Public: Portland, for example, has had anything but stellar performance. Transit has not kept up with growth, having lost 25 percent of its commuting (work trip) share since before the first light rail line was opened in 1986 (Note 1). With five new light rail lines, transit in Portland not only fell short of attracting its previous bus only share of commutes, but also sustained losses greater than the national rate (Figure 1).

    The people of the Portland area may not share The Economist’s ardor. Just last week, The Oregonian headlined "Clackamas County anti-rail measure passes comfortably; effect could resonate for decades," reporting on a 60-40 vote to require referenda for future rail expenditures. As if that were not enough, a similar measure passed by a similar margin in King City, a municipality in Washington County and Tigard, one of the area’s largest municipalities, has placed the matter on the November ballot.

    But Portland does have a substantial success missed by The Economist. Working at home is growing rapidly. From 1980 to 2011, working at home (mostly telecommuting) increased by 55,000. This is more than three times the growth in rail transit commuting (17,500). During the last decade, working at home passed transit as a work access mode in Portland, and with virtually no public expenditures (as opposed to the billions for new rail lines). There has been a 375,000 increase in car use by one-way commuters since 1980, and, not surprisingly, a quadrupling of excess travel time in peak period traffic (based upon Texas Transportation Institute data). In the end, Portland built an extensive rail system and the riders have not come. Portland didn’t expand its highway system, and they came anyway (National 2010-2011 journey to work data is summarized here.).

    In Los Angeles: Long on Rail Lines, Short on Passengers: The Economist rightly points out that Los Angeles has implemented policies to get people out of cars. Indeed, Los Angeles has been the poster child for transit development. In little more than two decades, 11 metro, light rail, and suburban rail lines have been opened. Probably no metropolitan area in the world has opened more miles of new rail service in that period. Matthew Yglesias, writing in Slate was so impressed that he called Los Angeles "America’s next great mass transit city."

    The results are less convincing. The total daily one-way commutes on the 11 rail lines is only 32,000, smaller than the number of people carried daily on a single lane of the San Diego Freeway (I-405) where it crosses over Wilshire Boulevard. Meanwhile, working at home has risen more than four times that of rail commuting since 1990 (Figure 2). Los Angeles may be better described as “America’s next great telecommuting city." However, the auto is still king. From 1990 to 2011, solo automobile commuting increased 340,000, two percentage point gain, three times that of transit.

    Younger People: Driving More to Work and Telecommuting More

    The Economist also jumps on the "young people forsaking driving" bandwagon, a subject that has attracted the attention of others. But, young people are driving more, at least to work. Since 2000, the increase in driving alone to work by people aged 15 to 24 was nearly 260,000, compared to a 4,000 loss in transit commuting. Working at home was up almost as much as driving, at 200,000. Even so, with the declining size of the younger work force, transit’s share was up. From 2000 to 2011, the share of 15-24 year old workers rose from 5.4 percent to 5.8 percent (Figure 3), virtually the same as the overall increase in transit market share of from 4.6 percent to 5.0 percent (Note 2). As with Portland and Los Angeles, the last 11 years saw a much larger increase in working at home, from 3.3 percent to 4.3 percent.

    Further, to the extent working at home, social media and online shopping replace the need for driving among younger adults (and everyone), all the better.

    The Fantastical Claim: 50,000 Passengers Per Hour

    The Economist repeats the specious claim that rail lines can carry 50,000 passengers per hour in each direction. If your world is limited to Paris between Chatelet and Gare de Lyon and the handful of similar places, maybe so. But in most of the rest of the world, it is the stuff of fairy tales.

    The 2011 data shows the extent of the illusion.  The fantastical rail line carrying 50,000 per hour would carry the equal of all the daily rail commuters in Dallas or Miami in less than 20 minutes. It would take only about five minutes to handle the daily rail transit commuting volume in Minneapolis or Salt Lake City.

    Further, some of the new systems have been manifestly unsuccessful in attracting commuters. For example, in Charlotte, there was a strong increase in transit commuting between 2000 and 2011, with transit’s market share rising 64 percent. Yet, more than 60 percent of the new commuters were on buses, rather than on light rail, reflecting a long overdue increase in artificially low service levels. In Phoenix, 85 percent of the transit commuting increase was on buses, rather than the light rail line. The fantastical 50,000 per hour line would take only handle this load in about two minutes.

    Where Rail Works and Why

    None of this is to suggest that rail transit does not have its place. As I pointed out in a Hong Kong Apple Daily commentary, rail transit makes all the sense in the world where appropriate (see: "Hong Kong’s Rail Expansion: Avoiding Western Pitfalls"). Appropriate circumstances include huge central business districts with high employment density and radial rail transit service from throughout the metropolitan area. American Community Survey data indicates that just six municipalities (not metropolitan areas) account for 93 percent of the nation’s rail commuting destinations. The city of New York, alone is the destination of 65 percent of national rail commuters. Another 28 percent commute to the cities of Chicago, Philadelphia, Washington, Boston and San Francisco. Within these six cities, the overwhelming share of transit commuting is to the downtowns (central business districts), which, combined, cover a land area less than half the size of Orlando’s Disney World.

    Why Driving Has Peaked

    Alan Pisarski told us in 1999 "(Cars, Women and Minorities: The Democratization of Mobility in America") that the demand for driving would soon peak. Women were driving nearly as much as men and cars were becoming the dominant mode of transport for low income people. Cars already carry the overwhelming majority of low-income commuters. A "love affair with the automobile" mentality misled many who should have known better into believing that people would eventually drive 24 hours per day. In fact, the huge increase in driving to the 2000s was more about democratizing mobility and access, and as the Washington Times recently put it, prosperity (see "A world without cars:
    The internal-combustion engine has freed mankind"). If home-based access can take up the slack, it would do more for the environment and people’s lives than all the expensive, largely ineffective rail system imagined by the media and the well-financed rail lobby.

    ——

    Note 1: The data in this article is largely taken from the journey to work reports of the US Census (1980, 1990 and 2000) and the American Community Survey (one year data 2011).

    Note 2: The overall 5.0 percent transit market share figure may be high. The USDOT National Household Travel  Survey (NHTS) indicates that people who commute by transit tend to use other modes (such as automobiles) often. NHTS data indicates that, overall transit accounted for 3.7 percent of commuters and an even lower 2.7% of commuting miles in 2009.

    Photo: Harbor Freeway (I-110), Los Angeles (by author)

  • Obama Fuel Economy Rules Trump Smart Growth

    The Environmental Protection Agency (EPA) has just finalized its regulation requiring that new cars and light trucks (light vehicles) achieve average fuel efficiency of 54.5 miles per gallon (MPG) by 2025 (4.3 liters per 100 kilometers). This increase in the "CAFE" standard (Corporate Average Fuel Efficiency) is the second major step in the Obama Administration’s program to improve light vehicle fuel efficiency. In 2010, EPA adopted regulations requiring 35.5 MPG average by 2016 (6.6 liters per 100 kilometers).

    The EPA standard is based upon carbon dioxide (CO2) grams emitted per mile of light vehicle travel, with an average of 163 grams per mile (101 per kilometer) to be achieved in 2025. This is slightly above the 2020 European Union standard of 152 grams per mile (95 grams per kilometer). Of course, the regulations have both supporters and detractors, with the automobile manufacturers being among the supporters.  

    Assuming the objectives are met, the reductions in CO2 emissions will dwarf the modest gains forecast from anti-suburban smart growth policies. For decades, this powerful movement has sought to limit or prohibit suburban expansion and even outlaw the detached housing that most people prefer. This includes railing against automobile use and seeking to coerce people out of their cars (as expressed by Secretary of Transportation Ray LaHood).

    The anti-suburban movement has many labels in addition to "smart growth," such as “densification policy," "compact cities," "growth management," "urban consolidation," etc. The origins can be traced back to just after World War II, with the enactment of the British Town and Country Planning Act. The policy origins of smart growth in the United States date from the 1960s (the state of Hawaii) and 1970s (the state of Oregon and California local jurisdictions).

    Forecast CO2 Emission Reductions from Smart Growth

    With concerns about greenhouse gas (GHG) emissions (principally carbon dioxide, or CO2), proponents saw the opportunity to force people back into the cities (from which most did not come) and turn smart growth into an imperative for "saving the planet." This is no exaggeration. As late as last month, this was claimed by fellow panelists at a Maryland Association of Counties conference. As is indicated below, the data shows no such association.

    Even forecasts by proponents fall short of demonstrating an apocalyptic necessity for smart growth. The Cambridge Systematics and Urban Land Institute Moving Cooler report attributed only modest reductions in CO2 emissions to smart growth’s land use and mass transit policies (Moving Cooler was criticized on this site by Alan Pisarski. See ULI Moving Cooler Report: Greenhouse Gases, Exaggerations and Misdirections). The data in Moving Cooler suggests an approximately 50 million ton reduction in CO2 emissions from these smart growth strategies by 2035 (interpolating between 2030 and 2050 figures).

    The more balanced Transportation Research Board Driving and the Built Environment: The Effects of Compact Development on Motorized Travel, Energy Use, and CO2 Emissions  produced similar figures, however it indicated skepticism about whether their higher range projections were "plausible."

    Comparing Smart Growth to the Previous Fuel Economy Standard

    At the 2005 fuel economy rate and the projected driving increase rate in the US Department of Energy Annual Energy Outlook:2008 (AEO), CO2 emissions from light vehicles would have increased 64 percent from 2005 to 2035 (Note 1). This could be called the "baseline" case or the "business as usual" case. This would have resulted in a CO2 emissions increase from light vehicles of approximately 0.75 billion tons.

    Using the more aggressive Moving Cooler forecast, the smart growth transport and land use strategies would only minimally reduce CO2 emissions from the baseline case (64 percent above 2005 levels) to 60 percent. This is "chicken feed" (Figure 1).

    Forecast CO2 Emission Reductions from the 54.5 MPG Standard

    Under the previous 35.5 MPG standard, AEO:2008 and AEO:2012,  a 19 percent reduction in CO2 emissions from cars and light trucks would occur from 2005 to 2035. We modeled the new regulations based upon AEO:2012 forecasts for the earlier regulation. This yielded a 2035 CO2 emission reduction of 35 percent from 2005 (Figure 2), despite a healthy one-third increase in driving volumes over the period. The calculation also includes an upward adjustment for the rebound effect, as lower costs of driving encourage people to drive more, which EPA estimates at 10 percent ("induced traffic"), which is indicated in Figure 3.


    Achievement of the 54.5 MPG standard would reduce CO2 emissions from light vehicles from 1.9 billion annual tons in 2035 under the 2005 baseline to approximately 0.750 billion metric tons in 2035. Approximately 70 percent of the decline in CO2 emissions would be from improved fuel economy, while 30 percent would be from slower annual increase in vehicle travel that has been adopted in AEO:2012 (Figure 4). The increase in driving is now forecast at 33 percent from 2005.

    The contrast between the potential CO2 emissions from smart growth and fuel economy is stark. By comparison, the annual overall reduction in CO2 emissions (from the 2005 baseline) would be virtually equal to the 30 year impact of smart growth (Figure 5).

    Comparison with Transit

    The 35.5 MPG standard would make cars and light trucks less CO2 intensive than transit. At work trip vehicle occupancy rates, the average new light vehicle would emit less in CO2 per passenger mile in 2016 than transit in all but eight of the nation’s 51 metropolitan areas over 1,000,000 population. The 2025 54.5 MPG standard would drop that number to two (Note 2). Even before these developments, there was only scant potential for replacing automobile use with transit (much less walking or cycling) because of its long travel times. According to data in a Brookings Institution report, less than 10 percent of jobs in the largest metropolitan areas can be reached by the average resident in 45 minutes on transit (Note 3).

    Smart Growth: Not Needed to "Save the Planet"

    Smart growth is an exceedingly intrusive policy that would attempt to enforce personal behaviors,    counter to people’s preferences, by attempting to dictate where people live and how they travel. This is expensive as well as intrusive. It is also detrimental to the economy, which is already taking a toll in lower household discretionary income (especially from higher house prices) and stunted economic growth.

    A report by The McKinsey Corporation and The Conference Board  indicated that sufficient CO2 emissions could be achieved with "…no downsizing of vehicles, home or commercial space and traveling the same mileage" and "…no shift to denser housing." Or, more directly, smart growth is unnecessary, in addition to producing little "gain" for the "pain."

    Wendell Cox is a Visiting Professor, Conservatoire National des Arts et Metiers, Paris and the author of “War on the Dream: How Anti-Sprawl Policy Threatens the Quality of Life.”

    —-

    Note 1: The 2030 to 2035 driving volume is estimated using the annual percentage increase from 2025 to 2030 in AEO: 2008, which has data through 2030.

    Note 2: Calculated from 2010 National Transit Database summary by Randal O’Toole of the Cato Institute. These calculations assume the 250 gram per mile standard for new light vehicles in 2016 and the vehicle occupancy ratio of 1.13 for work trips from the 2009 National Household Travel Survey.

    Note 3: Limited transit access is not just an American problem. In Paris, with arguably the best transit system in the western world, the average resident of a suburban new town on the regional metro (RER) can reach twice as many jobs by car as by transit in an hour, according to Fouchier and Michelon.

    Prius photo by Bigstock.

  • Evolving Urban Form: São Paulo

    São Paulo is Brazil’s largest urban area and ranks among the top 10 most populous in the world. Between 1950 and 1975, São Paulo was also among the globe’s fastest growing urban areas. For two decades starting in 1980 São Paulo ranked fourth in population among the world’s urban areas, but has been displaced by much faster growing urban areas like Manila and Delhi.

    São Paulo became Brazil’s largest urban area, displacing Rio de Janeiro, in the middle 1960s. There has been no looking back. By 2025, the United Nations forecasts that São Paulo will have 10 million more people than Rio (Figure 1).

    São Paulo is the capital of Brazil’s largest state, also called São Paulo. The 2010 census counted more than 41 million people in the state, more than live in California. The state of São Paulo is substantially more densely populated than California, occupying only two thirds of the land area (approximately the size of Oregon).

    There are other large urban areas in the vicinity of São Paulo. Campinas, an urban area of 2.5 million people, is located 60 miles (100 kilometers) north and San Jose dos Campos, an urban area of 600,000 is located 60 miles (100 kilometers) to the west.

    A 20th Century City

    Like many developing world megacities, São Paulo is a creation of the 20th century. In 1900, the population was 240,000. By 1950, the population had reached two million and now is approximately 20,200,000.

    São Paulo is located on a small plateau, over the mountains from the Atlantic Ocean 2500 feet (750 meters) above sea level, approximately the same elevation as Madrid. São Paulo is the world’s second largest urban area not located on an ocean or sea coast (Delhi is the largest).

    São Paulo is located 50 miles (80 kilometers) from the seaport of Santos, which is an urban area of 1.7 million. Santos is reached by one of the world’s most spectacular freeways, the Rodovia dos Imigrantes, which winds down the mountainside, with the southbound lanes crossing over the northbound lanes like the Interstate 5 Grapevine north of   Los Angeles, the grade down from Puebla (Mexico) to the city of Orizaba on Autopista 150D and a section of the N205 approaching Chamonix-Mont-Blanc in France.

    São Paulo’s Urban Expanse

    São Paulo is a comparatively dense urban area, at 16,500 persons per square mile, or 6400 per square kilometer. This makes São Paulo somewhat less than double the density of Paris, but still one quarter the density of Hong Kong or Mumbai and one seventh the density of Dhaka. The urban area covers 1,225 square miles (3,175 square kilometers), similar in size to the Miami and Washington DC urban areas.

    São Paulo is hardly a "compact city." The urban area stretches nearly 60 miles/100 kilometers east to west and more than 30 miles/50 kilometers north to south. The core city covers nearly as much area as the core city of Houston.

    Recent Growth and Suburbanization

    The central city (municipio) of São Paulo continues to grow. In the last 10 years, São Paulo  has grown from 10.4 million to 11.2 million. A majority of the urban area population, 57 percent, continue to live in the central city. However there is much stronger growth in the suburbs, reflecting the trends in nearly all other major urban areas of the world. Since 1950, São Paulo’s suburbs have experienced an explosive   growth, rising from under 200,000 residents to 8.4 million. This exceeds the core city’s growth over the same period of 7.46 million (Figure 2).

    In the last 10 years, suburban São Paulo has grown from 6.7 million to 8.4 million people, capturing   more than two thirds of the population growth. Since 1950, when the suburbs had approximately 5 percent of the population, they have increased their share in every census. However, if the strong growth of the city and the suburbs continues at the rates of the last 10 years, it could be 30 years before a majority of the population lives in the suburbs.

    Deficient Transport

    Like most nations, Brazil has a freeway or motorway system. There is a freeway between São Paulo and Rio de Janeiro and a freeway from São Paulo to the nation’s third largest urban area, Belo Horizonte. These and other freeways emerge from the urban periphery, without traversing the core.

    Yet, there is no way for trucks to traverse the São Paulo urban area from East to West without getting tied up in São Paulo’s monumental central area traffic. Nor is there a freeway for port traffic to cross the urban area south to north toward Campinas. Thus, truck traffic from the affluent urban areas of the South, such as Curitiba and Porto Alegre and the port at Santos is forced on to the Avenida Marginal Tiete and Avenida Marginal Pinheiros, forging an overused route adjacent to the urban core on both the west and north sides. East-west and north-south commercial traffic is combined on this roadway.

    However, São Paulo is building a long overdue ring road, the Mario Covas Beltway. Less than one half of this route is now in operation and the whole circle will not be completed until 2015.

    São Paulo is also on the trouble fraught high speed rail route proposed to run from Rio de Janeiro to Campinas. The route was roundly criticized by The Economist, which noted the low-balled costs, the astronomical ridership projections and the likelihood that Brazilian taxpayers would have to foot quite a bill to make it happen. This line was covered in more detail in Private Investors Shun Brazil High Speed Rail and High Speed Rail in Brazil: The Need for Guarantees.

    From Monocentricity to Polycentricity

    A number of other megacities in the developing world have added new commercial cores, becoming more polycentric, as the old central business district becomes comparatively less important. This is evident in Istanbul, Mexico City and Manila. In recent decades, most of the core-type commercial development has occurred along Avenida Paulista (two miles/three kilometers west of Centro) and then later, Luis Berrini (another 6 miles/10 kilometers further to the southwest).

    The Shantytowns

    As drivers travel on the Avenidas Marginal and the Mario Covas Beltway, they pass many shantytowns (favelas) close to the roadways. This can be a shocking site for North American rental car tourists. In more recent decades, favelas have developed not only on the urban fringe, but adjacent to affluent areas in the core (Photo). There are also corticos, which tend to be old subdivided houses and more centrally located. Both of these are increasingly interspersed through the urban area. A mid 1990s estimate placed the number of people living in this sub-standard housing at one quarter of the people in the central city of São Paulo.

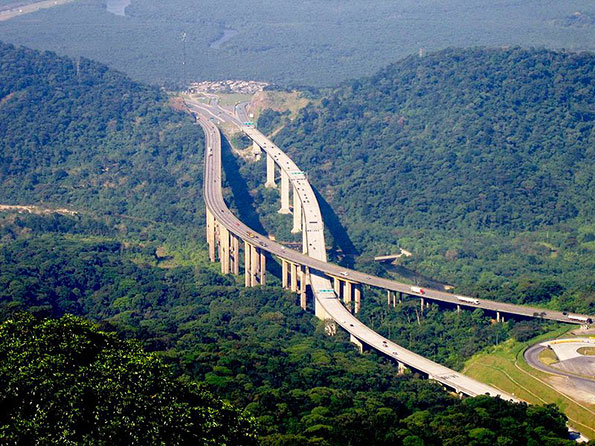
    Favela and Affluence, core city of São Paulo

    City of Hope

    The origins of this movement to Sao Paulo are clear. People moved from the poor countryside, often from the sugar plantations of the Northeast. As bad as life may look to affluent northerners, things are much better here than back in the countryside. Otherwise they would go home, which occurs with no material frequency. São Paulo, like all big metropolitan areas, is a city of hope.


    Wendell Cox is a Visiting Professor, Conservatoire National des Arts et Metiers, Paris and the author of “War on the Dream: How Anti-Sprawl Policy Threatens the Quality of Life.”

    Lead Photo: Paulista Avenue (by author)

  • New Setbacks for the Beleaguered California Bullet Train

    A proposal by Senator Michael Rubio (SB 317) to loosen California’s landmark environmental protection law commonly known as CEQA, has been shelved. The proposed legislation was intended to exempt the Central Valley rail construction project from CEQA requirements, thereby removing the threat of environmental litigation against the project. The bill, if approved,  would have likely led to the dismissal of currently pending lawsuits against the California High-Speed Rail Authority (CHSRA), and specifically the challenges filed by the Merced and Madera Farm Bureaus, according to Gary Patton, a California attorney who has been involved in environmental litigation. With environmental protections remaining in place, CEQA-based challenges could seriously  delay the start of construction and jeopardize the Authority’s ability to complete the Central Valley project by the federally imposed deadline of September 2017. Missing the federal deadline would deprive the project of the balance of the $3.3 billion federal grant.

    The unexpected cancellation of Sen. Rubio’s bill is credited to the opposition of powerful environmental groups and local elected officials. The latter sent a letter to Senate President Pro Tempore Darrel Steinberg and Assembly Speaker John Perez opposing "any proposal to create significant new exemptions or otherwise re-write CEQA in the days ahead." The proposed bill, wrote the officials, contain major changes to the existing law that have not been properly vetted and are being pushed  by "special interests in an end of session power play." In the end, Sen. Steinberg chose to side with the objectors rather than with a fellow Democrat.   "This law for all its strenghts and faults," he said, "is far too important to rewrite in the last days of the session."

    What Lies Ahead?

    The announced schedule for the California HSR procurement process calls for proposals from the five qualified bidders due in September 2012, contract award in December 2012, and Notice to Proceed  (on the 60-mile Merced-to-Fresno section of the line) in January 2013. No schedule has been announced for the Fresno-to-Bakersfield segment whose final EIR/EIS is not expected until early 2013.  

    However, before construction can begin (initially on a 29-mile line segment  from Madera to south of Fresno), the necessary rights-of-way for the HSR track must be acquired. The acquisition  process will include appraisals, acquisition offers, negotiations with land owners and relocation assistance (if any). These actions could be delayed by any potential legal challenges filed against the project by members of the Merced and Madera Farm Bureaus. 

    "It’s going to be a long battle for the Rail Authority, said Amanda Carvajal, executive director of the Merced County Farm Bureau. "There is going to be opposition every step of the way."  "We feel that the evidence against the Authority’s environmental document being adequate or truthful is solid," echoed Tom Rogers, President of the Madera County Farm Bureau in announcing the filing of a class action environmental lawsuit against the Authority in early June. Anja Raudabaugh, executive director of the Farm Bureau added,   "…this lawsuit was necessary to protect the bedrock economy of agriculture in the Valley. … We are actively seeking support from the community, local businesses and anyone who feels the rail project is to the detriment of their livelihood and way of life."    

    The strength of opposition to the bullet train in the Central Valley has led some observers to conclude that the actual groundbreaking and start of construction on the initial segment of the line could be many months if not years away. 

    New Operating Cost Analysis Casts Doubt on the Project’s Profitability

    New doubts concerning the financial viability of the California bullet train have been cast by the August 22 publication  of a report by William Warren and William Grindley, two prominent critics of California’s HSR project. The report challenges the Authority’s claim that the bullet train’s revenues will cover its operating and maintenance (O&M) costs as required by the enabling Proposition 1A law. The 198-page report concludes that  the high-speed train "is in the untenable position of having to compete against the low costs of automobile travel  and intra-California airfares while simultaneously meeting AB 3034 (Proposition 1A) requirement to be profitable."    

    To successfully compete with the low costs of driving and flying, the authors contend the bullet train must keep the per passenger mile (PPM) fares somewhere in the 20 cent/PPM range.  The average PPM fare for existing HSR systems is more than twice what the Authority projects —47 cents versus 23 cents/PPM.

    The authors used the Northeast Corridor’s high-speed train Acela  for their comparison because its operating costs offer the closest equivalent to the California bullet train in terms of  labor, power, maintenance and employee benefit costs   The real life examples show that existing high-speed rail  operating costs exceed 30¢/ PPM, while the Authority claims operating costs of only 10¢/ PPM. 

    The authors conclude: "The difference between the reality of high-speed rail’s operating costs and the fares CHSRA says they will charge can only be made up by subsidies which are  prohibited by law.   That means hundreds of millions to several billions of dollars  will need to be found from California’s taxpayers every year." 
    The report has received  wide distribution in Sacramento and  can be found at  www.sites.google.com/site/hsrcaliffr,  It will be also available at www.cc-hsr.org.

    Ken Orski has worked professionally in the field of transportation for over 30 years.

  • Texas High Speed Rail: On the Right Track?

    The Central Japan Railway (Note 1), which operates one of only two high-speed rail segments (Tokyo Station to Osaka Station) in the world that has been fully profitable (including the cost of building), proposes to build a line from Dallas to Houston, with top speeds of 205 miles per hour. This is slightly faster than the fastest speeds now operated. This line is radically different from others proposed around the nation and most that have been proposed around the world. The promoters intend to build and operate the route from commercial revenues.

    There is the understandable concern that eventually, the promoters will approach the state or the federal government for support. Not so, say Texas Central High Speed Railway officials. According to President Robert Eckels, not only is there no plan for subsidies, but "investors would likely walk away from a project that couldn’t stand on its own." He also told the Texas Tribune “If we start taking the federal money, it takes twice as long, costs twice as much,” Eckels said. “My guess is we’d end up pulling the plug on it.”

    Eckels is a former Harris County Judge (Houston), a position the equivalent of a county commission or county board of supervisors chair in other parts of the nation. Eckels developed a reputation for fiscal responsibility during his tenure at the county courthouse.

    The Texas project is in considerable contrast the California High Speed Rail project, which if built, is likely to require a 100 percent capital subsidy and perhaps subsidies for operations. It is also different from the Tampa to Orlando high speed rail project, which would have required a 100 percent capital subsidy and was cancelled by Florida Governor Rick Scott. The Texas project can also be contrasted with the Vegas to Victorville, California XpressWest high speed rail line that would require at least a $5.5 billion federal loan and a subsidized interest rate. Our recent Reason Foundation report predicted that XpressWest would not be able to repay its federal loan from commercial revenues and could impose a loss on federal taxpayers of up to 10 times the Solyndra loan guarantee loss (see The Washington Post, "Solyndra Scandal Timeline").

    From the horrific record of private investment in startup high speed rail lines and the huge losses that have been typical, I am certainly skeptical. The Taiwan high speed rail private investors have lost two-thirds of their capital investment and debts are guaranteed by the government. The Channel Tunnel rail line to St. Pancras station has been bailed out by British taxpayers. However, if any company can make money at high speed rail in the United States, it would be the Central Japan Railway.

    So far the Texas Central High Speed Railway seems to be doing it right. Like the other intercity modes, the airlines system and the intercity highway system (Note 2), this project would be paid for by people who use it.

    Without government subsidies or loans, the Texas Central High Speed Railway will certainly have an incentive to get the sums right. If they are not, it sounds like the plug will be pulled. If they are, high speed rail could be on the right track in the United States for the first time. More power to them.

    ——

    Note 1: Central Japan Railway, and other companies purchased the assets of the Japanese National Railway in the late 1980s. The nationalized railway had run up a debt of nearly $300 billion, which was eventually transferred to taxpayers.

    Note 2: There is a small subsidy to the airline system from the Federal Aviation Administration. Intercity highways have been financed by users until contributions from the federal general fund in recent years. However these contributions have been far less than diversions over the past 30 years from highway user fees, principally to mass transit a major transfer of highway trust fund interest to the general fund and now ongoing interest transfers.

    Photograph: Central Japan Railway corporate headquarters at Nagoya Station (by author)

  • Congratulations to America: Huge Greenhouse Gas Emission Reduction

    Congratulations to America. According to the US Department of Energy, Energy Information Administration, carbon dioxide (CO2) emissions were reduced 526 million tons from 2005 to 2011. This is no small amount. It is about the same as all the CO2 emissions in either Canada or the United Kingdom. Only five other nations emit more than that.

    The bigger news is that this was accomplished without any of the intrusive behavioral modification proposed by planners, such as by California’s anti-detached housing restrictions, Plan Maryland, or the state of Washington’s mandatory driving reduction program.

    Of course, part of the national reduction was due to the economic difficulties since 2005. However, even with 1.8 percent gross domestic product growth in 2011, EIA shows that CO2 emissions fell 2.4 percent in 2011.

    The magnitude of the decline over six years is impressive. Actual GHG/CO2 emissions were reduced more annually between 2005 and 2011 than smart growth proponents claim for their strategies after 45 years of draconian policy intrusions.Modeled smart growth forecasts in Moving Cooler’s middle scenario (by Cambridge Systematics and the Urban Land Institute) show the annual GHG/CO2 emission reduction in 2050, calculated from 2005, to be less than the emissions reduction in the average year between 2005 and 2011.

    This is despite what would be four decades of trying to force people to live where they don’t want, in housing they don’t prefer, while trying to drive them out of the cars that required to sustain economic growth in modern metropolitan areas.

    Moving Cooler’s forced densification and anti-automobile strategies were so radical that the Transportation Research Board authors of Driving and the Built Environment, could not agree that a similar approach was feasible, because it would be prevented by public resistance to the personal and political intrusions (Note 1). They would also be hideously expensive, as the Moving Cooler authors ignored the much higher costs of housing associated with smart growth’s behavioral strategies.

    This comparison demonstrates the conclusion of a recent Cambridge University (United Kingdom) led study (see "Questioning the Messianic Conception of Smart Growth", which stated:

    In many cases, the potential socioeconomic consequences of less housing choice, crowding, and congestion may outweigh its very modest CO2 reduction benefits.

    Government policies have had little to do with the reductions, except to the extent that they precipitated the greatest economic downturn since the Great Depression (such as by encouraging loose lending standards and the smart growth housing policies that drove house prices up so much that the housing bust became inevitable).

    Market forces have made a substantial contribution to the reduction. There was a substantial shift to the use of natural gas from coal, a conversion that is really only starting. There was also a modest improvement in automobile fuel efficiency (though much more is to come).

    In 2007, the McKinsey Corporation and The Conference Board published a study (co-sponsored by the Environmental Defense and the Natural Resources Defense Council), which said that sufficient GHG emissions reductions (Note 2) could be achieved without driving less or living in more dense housing. Our more recent Reason Foundation report showed that the potential for GHG emission reduction from more fuel efficient cars and carbon neutral housing far outweighed any potential for reductions from smart growth’s behavior modification.

    ——

    Note 1: Transport consultant Alan E. Pisarski evaluated Moving Cooler in an article entitled ULI Moving Cooler Report: Greenhouse Gases, Exaggerations and Misdirections.

    Note 2: Most of GHG emissions are CO2.