Tag: Transportation

  • The Beijing Bicycle: A Requiem

    Just because China has 500 million bikes on the road or tucked away in sheds or courtyards does not mean the two-wheeler has a bright future there, especially in its largest cities.

    Such is the growing indifference to the bike in China that no one seems to mind that the national model is manufactured in Taiwan (or under license on the mainland). With a single gear and heavy steel frame, the Giant is ideal for long rides on flat city streets. At a cost of US $180, it is the bike bargain of the world. Nevertheless, the dream for younger Chinese is a Honda scooter.

    The problem now in Beijing, Xian, and Guangzhou, if not in the country at large, is that increased prosperity is making city bike riding that much more a thing of the past. Wonderful Asian bike cities like Hanoi have already been lost to the noisy scooter and small car. Is Beijing next?

    Three years ago, Beijing was delightful by bike. Initially, I signed up with my friend George at Bicycle Kingdom to teach me the tricks of the narrow streets and the detours around Tiananmen Square. Ever since that first night of instruction, when we rolled out to the Olympic Park and down to the Temple of Heaven, I have been pedaling on my own power in Beijing and savoring every moment in the saddle.

    One reason that biking in Beijing is such a pleasure is that riders are accorded privileges lost to those sitting in traffic jams or drifting around on tour buses. During the 60th anniversary of the Chinese Revolution, a bike got me a front row seat to the spectacle.

    Beijing bikes have their own lanes, traffic lights, and rights-of-way, and a rider can easily thread his or her way anywhere. At railroad stations there are special bicycle parking lots, and even at the Forbidden City it is possible to leave your bike next to the front gate, as if you were a Mandarin.

    A few of the parks are off-limits to riders, but to my mind the only way to explore the hutongs — the historic districts of old Beijing, laid out like rabbit warrens — is on a bike, with which it is possible to roll past tea houses, food stalls, and open shops, as if in a Venetian gondola.

    Recently back in the capital, I spent a long day riding from Tiananmen Square out to Peking University, near the Summer Palace — about fifteen kilometers (a little more than nine miles) to the northwest.

    I had mapped out my route using a mixture of back streets and boulevards, and rolled away to find the Beijing grave site of the American writer Edgar Snow, whose 1937 book, Red Star Over China, was the first English-language account of Mao Tse-tung and a reportorial classic. (They met near Yenan, to which I went by train, but where there are almost no bikes.)

    To be sure, bike riding in Beijing is an acquired skill. I accept that it means weaving around buses, parked cars, delivery vans, and other obstacles. What surprised me on this long ride — about three hours in all — is how often the bikes lanes were flooded with motor scooters, cars, and a variety of motorized contraptions.

    After a while, I had my eyes attuned to the demographics of bike riders. They tended to be school kids or the elderly. From this blacktop survey, I judged that middle-aged or prosperous Beijingers have little appetite for riding. Most were moving around on scooters, the kind that have clogged many Asian cities.

    On earlier bike rides around Beijing, I found the experience sublime. This time it felt like I was riding for my life in New York City, outnumbered and outgunned by a variety of taxis, swerving motorists, and motorcyclists.

    Not only is Beijing going the way of Bangkok and other Asian cities that have been lost to gridlock, but the effects of non-riding can been seen among the Chinese themselves, more of whom are obese; undoubtedly KFC and McDonalds don’t help, either.

    Beijing is not the only Chinese city where I found biking on the wane. On my recent trip I also visited Xian, Chongqing, and Guangzhou, in search of Maoist redoubts and World War II battlefields. Chongqing (which has an excellent General Joseph Stilwell Museum and a Chou En-lai house) is built on hills, like San Francisco, so it has never been much of a bike city. Xian and Guangzhou are ideal for the bike, at least in their historic quarters. Yet each city is now overrun with cars.

    In Xian, I spent a long time just trying to find a shop that would rent me a bike. I went to several where the owners just shrugged. Finally, I borrowed a neglected bike from a hostel, but first had to take it in for repairs. No one had ridden this Giant in weeks, and the seat was set for a Lilliputian.

    You wouldn’t cycle to see the Terra Cotta warriors on a local clunker, as they are an hour by car from the city. But a bike is perfect to explore the Muslim quarter or to take in the Xian Incident Museum, which tells the story of Chiang Kai-shek’s kidnapping in 1936 and his subsequent agreement to recognize the Communist party. (Nothing focuses the mind like a kidnapping.) In Guangzhou I made it to the Sun Yat-sen Museum, but the snarling traffic scared me into a taxi.


    In Beijing and other cities, you still see bicycles loaded with garbage bags, cords of wood, furniture, dumplings, racks of clothing, and things like hundreds of fresh eggs. Some riders can comfortably bike around several family members on one frame, and it’s not unusual to see children following a parent through a busy intersection. In one alley, I biked alongside a man using his bike to move a large desk.

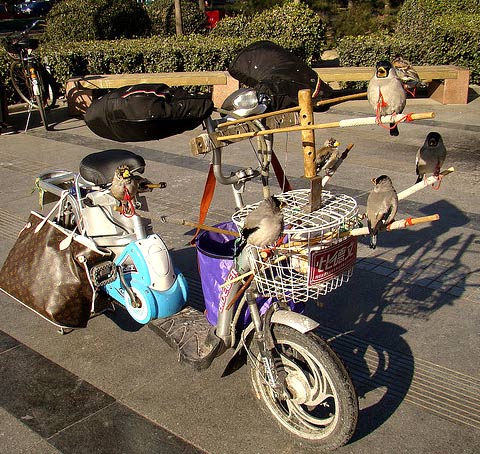
    In Beijing and Xian, I especially love the cyclists who have rigged up devices so that they can ride around with their caged birds, although one cycling raven of my acquaintance just sat on a wooden perch across the handlebars. Where will he be in five or ten years? I hate to think that Edgar Allen Poe was a writing an elegy for, among other things, the Beijing bike:

    Quoth the raven, “Nevermore.”

    Matthew Stevenson, a contributing editor of Harper’s Magazine, is the author of Remembering the Twentieth Century Limited, a collection of historical travel essays. His next book is Whistle-Stopping America.

    Photo: Raven on a Bicycle, Beijing, by the author.
    Flickr Photo: Bird Scooter; birds and paraphernalia on a bike in Beijing by IstoletheTV.

  • Cities, Cars, People: Is Changing Car Use a Function of New Urbanism?

    One cornerstone for urban designers and planners seeking to transform the polycentric or suburban city of the 20th Century into something resembling the high density city of the 19th was a cross-city comparison by Newman and Kenworthy and successors. [1]   They argued that this proved automobile dependence is a function of city density.  It followed that regulating for greater residential densities and increasing the capacity of public transport systems to avoid the congestion that would follow if people continued to drive themselves would improve the sustainability of cities.

    Of course, any comparison with the overcrowded and unhealthy cities of an earlier century is unfair: today’s density is achieved with higher standards of private and public space, and much enhanced transit and sanitation.  And many, probably the majority, of 21st century citizens in high income nations can escape the confines of the urban environment on occasional sojourns to country or coast (or beyond), unlike their 19th Century or developing world counterparts.  They can even find repose in the midst of 24/7 city hubbub in their own in-house media centres.

    But can we really build urban policy on the Newman and Kenworthy analysis?  Especially given evidence that car use is declining anyway?

    Questionable correlation
    There are still questions over the original analysis and it successors.  Cross-cultural effects, physical geography, differences in economic structure, incomes, wealth, and growth all intervene in the relationship between city density and car dependence.  And cause and effect are hard to pin down. 

    Perhaps more critical: the leap from observing relationships across cities at a point in time to regulating travel behaviour, housing ,and consumption choices into the future assumes that individual behaviour is a microcosm of collective behaviour. This fallacy of inference has long been recognised by the biological and sociological sciences.  And the likelihood of getting policy wrong by making such an assumption is far greater when dealing with populations of people, with their diverse circumstances, beliefs, values, and means, compared with, say, populations of penguins. 

    Is it this blind spot that has made it so much more difficult to get people out of their cars or their low density houses than anticipated by urban reformists?

    The city as a time warp
    One problem is that analyses of city density and car dependence are usually static.  Plotting urban form and transport consumption at a particular point in time – the mid/late 20th century in the Newman and Kenworthy case – embodies particular patterns of technology, wealth, and behaviour.  Consequently, their urban prescription is based implicitly on the 9 to 5 work day; single city centres that focus urban employment, exchange, and consumption; and the nuclear family with its distinctive housing and service demands. These are all urban artifacts that have been breaking down since the 1960s.

    But the times they are a-changing
    In a 2011 paper the authors acknowledge that things are changing as international evidence shows rates of car use beginning to decline in parts of the world.  A partial view of what they are changing from, though, sustains a deterministic explanation of the why and what they are changing to:

    “technological limits set by the inability of cars to continue causing urban sprawl within travel time budgets; the rapid growth in transit and re-urbanization which combine to cause exponential declines in car use; the reduction of car use by older people in cities and among younger people due to the emerging culture of urbanism and the growth in the price of fuel which underlies all the above factors”.[2]

    The view remains time-bound; even the reference to exponential decline is a simplistic inference of the relationship between public transport and car use taken from a cross section of cities in 1995. 

    Individual agency barely gets a mention.  Any description of an “emerging culture of urbanism” needs to be embedded in the reality of evolving patterns of wealth, income, and consumption and even in simple demographics to determine just how real and significant it is.

    Growing old and driving more
    What are the grounds for the claim that older people are reducing their car use, for example? I took a quick look at the evidence for New Zealand.  It is certainly not the case here.  The rate of growth in driving has been higher among older age groups than among younger – with decline most evident among the under 45s.  

    Is it so different in the other ageing societies from which Newman and Kenworthy draw their examples?

    Figure 1: Changes in Annual Driving Distance by Age, New Zealand 1990-2008


    Fewer kilometres doesn’t mean less dependence
    What does go a long way to explaining declining car travel in the aggregate is the fact that older people don’t drive as much younger people, and populations in western cities are simply getting older.  It’s simple maths – as the population ages car usage will go down, despite a greater propensity to drive among older cohorts. Again, look at the evidence from New Zealand:

    Figure 2: Automobile Dependence by Age Group, New Zealand 2004-2008


    Car usage appears to decline after age 44, rapidly after retirement age, 65. 

    Why does car use fall with age?
    There are a number of reasons why this may be so.  From 45 years on households have fewer transport-dependent children.  Mature families may have more localised social networks.  A greater share of recreation may be neighbourhood based.

    On retirement work trips disappear and incomes, discretionary dollars and consumption fall.  The capacity for more shared travel and trip planning increases as households age.  Diminished car use doesn’t necessarily mean that households are less automobile dependent.  They just doesn’t generate as much travel demand.

    These explanations don’t depend on particular urban designs.  Yet Newman and Kenworthy claim that diminished driving happens because “older people move back into cities from the suburbs”.  This is not consistent with the common observation of people’s preference to age in place.[3]  (For the New Zealand evidence, see my posting Ageing in the City).

    Moving into the centre – a one-way street?
    And their notion “the children growing up in the suburbs would begin flocking back into the cities rather than continuing the life of car dependence” rather simplifies a historically specific event: the transition of sons and daughters of the baby boomers from young adulthood, advanced education, and job seeking to the career and housing paths associated with their movement into more stable relationships.  As they age, it is highly likely that suburban preferences re-emerge, sustained by the capacity to purchase and operate a private vehicle.

    Generation X boosted inner city dwelling over the past two decades, and Generation Y will do so, to a lesser extent, for another decade.  The 15 to 24 year age group also coincides with the age of greatest automobile independence (illustrated for New Zealand in Figure 3).  But don’t expect this historically-specific phenomenon to sustain some sort of indefinite culture of city consolidation, and I wouldn’t bet the fiscal bank on expensive transit systems designed around the assumption that it will. 

    These are passing generations: their successors will be that much smaller and facing a somewhat different world.[4]

    Figure 3: Use of non-Automotive Modes by Age Group, New Zealand 2004-2008


    Who are we planning for?
    Of course, there are plenty of exceptions to prove the rule: but that is the point.  Diverse communities have diverse expectations and behaviours. And they are continuously changing, in composition, in form, and in behaviour. 

    The failure of modernity lay in its assumption of conformity and convergence, compounded by the conceit that we could regulate for it.  And planning for what is little more than a statistical construct – the auto-independent city – risks blinding us to the richness and opportunity of alternatives, of lifestyle, of environmental stewardship, of urban design, and of mobility.

    If we start with the behaviour of individuals and households our designs for sustainable cities may be less deterministic and our planning less didactic, better informed, lighter in touch, and a lot more effective in meeting the long-term needs of evolving urban communities.

    Phil McDermott is a Director of CityScope Consultants in Auckland, New Zealand, and Adjunct Professor of Regional and Urban Development at Auckland University of Technology.  He works in urban, economic and transport development throughout New Zealand and in Australia, Asia, and the Pacific.  He was formerly Head of the School of Resource and Environmental Planning at Massey University and General Manager of the Centre for Asia Pacific Aviation in Sydney. This piece originally appeared at is blog: Cities Matter.

    Aukland photo by Bigstockphoto.com.


    [1]            Newman, P and Kenworthy J (1989) Cities and Auto Dependency: A Sourcebook. Gower, Aldershot
                         Newman, P and Kenworthy, J Sustainability and Cities: Overcoming Automobile Dependence, Island Press, Washington, D.C.
    [2]        Newman P and Kenworthy J (2011) “‘Peak Car Use’: Understanding the Demise of Automobile Dependence”, World Policy Transport and Practice, 17, 2, 31-42
    [3]        Pynoos R, Caraviello R, and Cicero C (2009) “Lifelong Housing: The Anchor in Aging-Friendly Communities”, Journal of the America Society on Aging, 33, 2, 26-32
    [4]         For New Zealand, check the numbers

  • More Unwelcome News for the California High Speed Rail Project

    Decidedly, early June has not been the best of times for the California high-speed rail project.

    On June 2, came a new poll showing that fifty-nine percent of voters would now oppose building high-speed rail if the measure were placed on the ballot again. Sixty-nine percent said that they would "never or hardly ever" ride the bullet train if it were built. (USC Dornsife/LA Times survey). The poll made news throughout the state, and indeed nationally. The public was treated to headlines such as "Voters have turned against California bullet train" (LA Times); "California high speed rail losing support" (Bloomberg); "California high speed rail doesn’t have the support of majority of Californians" (Huffington Post); "Voters don’t trust state to build high speed rail" (CalWatchdog) and "Poll finds California voters are experiencing buyers’ remorse" (Associated Press).

    Then, on the heels of the poll, came news that Central Valley farm groups have filed a major environmental lawsuit asking for preliminary injunction to block rail construction slated to begin later this year. Plaintiffs include the Madera and Merced county farm bureaus and Madera County. Still more agricultural interests in the Central Valley are reportedly threatening to sue.

    The Sierra Club, traditionally a loyal supporter of Gov. Brown, announced it was "strongly opposed" to Brown’s proposal to eliminate California environmental (CEQA) requirements for the high speed rail program and its Central Valley construction project. The Brown administration has made its proposal despite a solemn promise to the legislature by the Authority’s Chairman, Dan Richard, that they would never try to bypass CEQA ("We have never and we will never come to you and ask you to mess with the CEQA requirements for the project level").

    The multi-billion dollar HSR program is exactly the sort of large scale public works project that CEQA was designed to address, wrote Kathryn Phillips, Sierra Club’s Director in a June 5 letter to the Governor. "By removing a large-scale project such as high-speed rail from full CEQA coverage, the proposal grants the state a status that suggests it does not have to fully and seriously consider and mitigate environmental impacts. … In the interests of the environment and in the interest of rebuilding public support for rail in this state, we urge you in the strongest possible terms to abandon the proposal to weaken environmental review for the high-speed rail system," the letter concludes.

    Nor was this the end to unwelcome news for the Brown administration. A series of editorials and opinion pieces by some of California’s most influential columnists has reinforced the public’s growing disenchantment with the bullet train project and with the Governor’s stubborn determination to defy public opinion.

    In a June 3 commentary,  the Sacramento Bee columnist Dan Walters, a longtime observer of the legislative scene, refuted the Governor’s attempt to compare the high speed rail project with the iconic Golden Gate Bridge. Both projects, the Governor had said in a ceremony marking the 75th anniversary of the bridge, took much political courage and foresight, and both will go down in history as remarkable gifts to posterity.

    "Nice try, Governor," wrote Walters, but the comparison is misleading. The need for the Golden Gate crossing was clearly demonstrable and the bridge used revenue bonds to be repaid with bridge tolls. The need for a bullet train, on the other hand, "exists only in the minds of its ardent backers" and the Governor assumes that the federal government will finance nearly two-thirds of the project’s cost—an assumption that is nothing more than wishful thinking. Asked Walters, if the train is as financially viable as Brown and the Authority insist it is, why wouldn’t they do what the bridge builders did — float revenue bonds to be repaid from the train’s supposed operating profits. "Public works projects make sense when they fit well-documented needs. When they don’t, they are just political ego trips," Walters concluded.

    Daniel Borenstein, columnist and editorial writer for the Contra Costa Times, came to a similar conclusion. In pushing for the bullet train, he wrote, Gov. Brown is motivated by a quest for a legacy. But, the columnist warned, while the Governor strives to be remembered like his late father for the capital projects he leaves behind, he could derail the November tax measure by his "reckless exuberance for spending billions on high speed rail." "Does he really want to anger [the voters] when he needs them the most?" Borenstein asked.

    Perhaps the most devastating criticism of the Governor’s high speed rail initiative came in a June 8 editorial in the San Jose Mercury News, one of the Bay Area’s most influential newspapers. Entitled "High Speed Rail Plan is Delusional" the editorial has been syndicated in a number of Bay Area and Los Angeles Sunday papers. Follow this link to read it at the Mercury News website.

  • The Atlanta Transportation Tax: Too Much for Too Little

    On July 31, voters in a 10 counties of the 28 county Atlanta metropolitan area will vote on whether to raise the sales tax by one cent for $8 billion in transit and highway projects over 10 years. The measure is highly tilted towards transit spending. Sadly, this would do virtually nothing to reduce Atlanta’s traffic or its travel times.

    In a metropolitan area in which barely one percent of travel (Figure 1) and less than five percent of work trip travel is by transit, the tax measure devotes more than 50 percent of the funding to transit (Figure 2).   Yet in reality, the focus of any transportation revenue issue should be on reducing travel times, whether by transit or highways. This is how transportation improves an urban economy. The reality is that with nearly all travel by highways and transit’s inherently slower travel times, much of the tax money would have virtually no impact on reducing travel times or traffic congestion.


    Atlanta’s Traffic Congestion: Promoters of the tax claim that the highway projects will reduce traffic congestion. Atlanta is well known for its serious traffic congestion. There are two reasons for this:

    1. Atlanta’s sparse freeway system is limited to little more than a belt route (I-275) and three radial freeways (I-20, I-75 and I-85) that converge into two in the one place more capacity is needed, the core. Trucks are not permitted on freeways inside the beltway, which concentrates the considerable interstate traffic on a single roadway, I-275. If Atlanta had the higher freeway density (freeway mileage per square mile) of Los Angeles or Minneapolis-St. Paul, traffic congestion would be far less of a problem.
    2. Atlanta’s regional arterial (high capacity streets) system is virtually non-existent. For this reason, I proposed (in 2000) development of a one-mile terrain constrained grid of arterials. The Atlanta Regional Council (ARC), the local metropolitan planning organization, has included a somewhat more modest (but useful) arterial grid in is regional plan.

    Yet despite its reputation, Atlanta’s traffic congestion could be worse. The latest INRIX National Scorecard rates the Atlanta metropolitan area as having the 15th worst traffic congestion in the nation, behind Portland, which is nearly 60 percent smaller and twice as dense, with its compact city policies. Among high-income world metropolitan areas with more than 5 million population, only Nagoya outside the United States may have a shorter work trip travel time (Note 1). Atlanta’s world-competitive work trip travel time of 29 minutes is faster than that of far more transit-dependent Toronto (33 minutes), smaller Sydney (34 minutes) and much smaller Vancouver (31 minutes), despite their compact city policies.

    The Transit Projects: So Much for So Little: The proposed transit projects have virtually no potential to reduce work trip travel times and traffic congestion. Approximately one-fifth of the transit funding would be used to rehabilitate and upgrade the MARTA subway system, a need that should have been legitimately funded from the existing MARTA sales tax. Another nearly 20 percent of the transit funding would be spent on the "Belt-Line" streetcar project in central Atlanta. The role of the Belt-Line is more "city building" (read "real estate speculation") than it is transportation. It will do nothing to reduce work trip travel times. Further, it is exceedingly costly. The extravagance of this project is illustrated by an annualized capital cost alone (principally construction) high enough to pay the lease on a new mid-sized car for each new regular passenger (Note 2). Moreover, that is before the likely capital cost escalation and the substantial operating subsidies (Note 3).

    Transit’s problem in Atlanta (and elsewhere) lies outside its core downtown job market (Note 4). Most destinations in a metropolitan area cannot be reached by transit in a way remotely competitive with the car. The transit tax would only modestly increase transit ridership. ARC projects the transit projects will boost daily transit ridership less than 10 percent. If all of the forecast new passengers were to be taken from cars (which is not likely), the net reduction in traffic volumes over ten years would be equal to less than three months of traffic growth. Put another way, at the best, the transit proposals would mean that the traffic congestion expected on January 1, 2025 would not occur until March of 2025. That’s less than 90 days of traffic relief for 10 years of taxation.

    The Road Projects: In a metropolitan area in which personal mobility predominates, roadway improvements, such as expansions, an arterial grid in Atlanta’s case and completion of the GA-DOT HOT (high occupancy toll) system provide far greater  potential for reducing travel times. There is another significant benefit to highway investments. As traffic speeds increase fuel efficiency improves and both air pollution and greenhouse gas emissions are reduced.

    Under the tax referendum, a significant opportunity to improve mobility would be missed, to the detriment of the vast majority of Atlantans; over 88 percent of all commuters in Atlanta travel by car, but the figure is only slightly less (83 percent) among low income commuters (Figure 3).

    What’s Right About Atlanta: For all its problems, Atlanta has much to be proud of. Former World Bank principal planner Alain Bertaud said of Atlanta in a 2002 study:

    While income and population were rising very fast, Atlanta managed to keep a very low cost of living. A worldwide cost of living survey conducted by the Economist Intelligence Unit in 2002 found that Atlanta had the lowest cost of living among major US cities and ranked 63rd among major cities around the world. This achievement is remarkable in view of the rapid rate of growth of the metropolitan area over the last 20 years. It shows that while demographic and economic growth has certainly contributed to generate pollution and congestion, the various actors responsible for the management of metropolitan Atlanta must have done a lot of things right. High income growth and high demographic growth combined with a low cost of living suggests that labor markets are functioning well and that housing does not encounter important supply bottlenecks (Note 5).

    As successful as local land use policies have been in making Atlanta livable by making it affordable (the first principle of livability is affordability), local leaders need to start over with a proposal primarily designed to reduce traffic congestion, reduce travel times and grow the economy.

    Politics Trumps Reducing Traffic Congestion: Traffic congestion is most effectively addressed by projects that reduce work trip travel times, since it is the concentration of work trips at peak hours that   causes the worst congestion. The long-suffering commuters of Atlanta would have been far better served by a program that selected projects based upon their effectiveness in reducing travel times. A simple cost per hour of delay measure would have been appropriate. Atlanta deserves a much better deal.

    Wendell Cox is a Visiting Professor, Conservatoire National des Arts et Metiers, Paris and the author of “War on the Dream: How Anti-Sprawl Policy Threatens the Quality of Life.”

    —————–

    Note 1: Based upon 109 metropolitan areas for which data is available. Japanese data is reported as median work trip travel time. Nagoya’s median work trip travel time (27 minutes) is less than Atlanta’s (29 minutes). The excessively long rail commute times of many Japanese commuters could make Nagoya’s average work trip travel time as great or greater than Atlanta’s. Dallas-Fort Worth has the shortest work trip travel time of any metropolitan area over 5 million population (and the lowest transit work trip market share)

    Note 2: A team led by Oxford University professor Bengt Flyvbjerg found that passenger rail systems typically have cost overruns of 45 percent. If the average increase is experienced, the Belt-Line cost could escalate to $1 billion.

    Note 3: The capital cost is discounted at 4 percent over 35 years, which equals more than $5,500 annually. A new Ford Fusion, Toyota Camry, Honda Accord or Nissan Altima could be leased for less than $5,000 annually, with no down payment, according to internet sources (such as http://www.leasecompare.com/)

    Note 4: More than 93 percent of metropolitan Atlanta’s employment is outside downtown (and Mid-Town). Downtown’s share of employment declined from 2000 to 2009 (latest data available from the US Census Bureau, County Business Patterns).

    Note 5: Atlanta was most affordable major metropolitan area in the US, UK, Canada, Australia, Ireland, New Zealand and Hong Kong in the 8th Annual Demographia International Housing Affordability Survey.

    ——

    Photo: Atlanta Freeway (by author)

  • Thoughts on High-speed Rail and Buses

    I’m back from a California trip – beautiful state, beautiful weather, completely dysfunctional government.  For example, even with massive fiscal problems it’s still trying to build a vastly expensive high-speed rail line from San Francisco to San Diego. On a related note, a private group is exploring building a Houston-Dallas HSR line with no subsidies of any kind. I’m totally okay with private efforts.  I’m probably even okay with a little eminent domain to get the right of way at a fair price. I hope they can make it work.

    Here’s a great alternate perspective on HSR: a TED talk on the value of perception and psychology vs. economics and technology.  Go to the 6:12 point to see a great example of the Eurostar train, where they spend a vast amount of money to reduce travel times by 40 mins, when for 90% or 99% less money they could have improved the experience instead and actually gotten higher rider satisfaction.  I believe the absolute same principle applies to bus vs. rail, whether intra- or inter-city: spend 1% or 10% of the same money improving the bus service and get higher customer satisfaction than the rail line would generate.  (hat tip to Karl)

    And Greyhound is doing just that, learning from Megabus and upgrading their service with wifi, power plugs, and nicer seats with more leg room.  With that kind of service option available at say $30 one-way within the Texas Triangle, how many people do you think would pay $150+ to go on HSR?  On second thought, maybe nobody should mention this possibility to the Texas HSR group…  😉

  • Toward More Competitive Canadian Metropolitan Areas

    The Federation of Canadian Municipalities (FCN) and the Canadian Urban Transit Association (CUTA) have expressed serious concern about generally longer commute trip times making Canadian metropolitan areas less competitive. Each has called for additional funding for transit at the federal level to help reduce commute times and improve metropolitan competitiveness.

    The Right Concern

    The concern over commute times is well placed. Economic research generally concludes that greater economic and employment growth is likely where people can quickly reach their jobs in the metropolitan area. Five of the nation’s six major metropolitan areas (Toronto, Montréal, Vancouver, Ottawa-Gatineau and Calgary) have average one-way work trip travel times that are among the highest in their size classes among 109 metropolitan areas in the more developed world for which data is available. Only Edmonton has an average commute time that is among the shortest (Table 1).

    Table 1
    Average One-way Commute Times: Major Metropolitan Areas
    Compared with International Major Metropolitan Areas
    Major Metropolitan Area One-way Commute Time (Minutes) Overall One-way Commute: Rank out of 109 One-way Commute: Rank in Population Class
    Population Size Class
    Toronto 33 97th  Over 5,000,000 11th out of 19
    Montréal 31 90th  2,500,000 – 5,000,000 19th out of 23
    Vancouver 30 86th  1,000,000 – 2,500,000 60th out of 67
    Ottawa-Gatineau 27 60th  1,000,000 – 2,500,000 55th out of 67
    Calgary 26 58th  1,000,000 – 2,500,000 50th out of 67
    Edmonton 23 15th  1,000,000 – 2,500,000 15th out of 67


    The Wrong Answer

    Yet the solution – more transit and funding for transit – misses the mark. Transit does many things well, but it does not reduce commute times (Figure 1). According to Statistics Canada, average commute times by transit in the Toronto, Montréal and Vancouver metropolitan areas are from 30 per cent longer to nearly double those of average automobile commuters (Note 2). Some 58 percent of car users (drivers and passengers) reach their work locations in under 30 minutes, something accomplished by merely y 25 percent of transit commuters. Overall Toronto commute times are longer than either Los Angeles – famed for its traffic – as well as much less dense, and far less transit dependent, Dallas-Fort Worth. In Toronto, 21 percent of commuters take transit, compared to two percent in Dallas-Fort Worth. Among Montréal commuters, 20 percent use transit and spend more time commuting than their counterparts in more decentralized Phoenix, where less than two percent take transit. Commute times in transit-focused Vancouver are worse than much larger Los Angeles and indeed longer than nearly American metropolitan area, including Dallas-Fort Worth, Houston, and Philadelphia (Table 2).

    Given this pattern, transferring car travel to transit likely would increase commute times and make metropolitan areas even less competitive.

    Table 2
    30- and 40-minute Commute Shares:
    Representative Metropolitan Areas
    Population Classification Work Trip Under 30 Minutes Work Trip 30 to 44 Minutes Work Trip Under 45 Minutes
    5,000,000 and Over      
    Dallas-Fort Worth 59% 24% 83%
    Los Angeles 55% 24% 79%
    Toronto 48% 25% 73%
    Paris 45% 22% 67%
    2,500,000 – 5,000,000      
    Phoenix 57% 26% 83%
    Montréal 47% 27% 74%
    1,000,000 – 2,500,000       
    Edmonton 68% 20% 88%
    Indianapolis 66% 22% 88%
    Ottawa-Gatineau 65% 21% 86%
    Tampa-St. Petersburg 62% 22% 84%
    Calgary 54% 29% 83%
    Vancouver 55% 21% 76%
    Source: Statistics Canada, U.S. American Community Survey, National Institute of Statistics and Economic Studies (France)


    The Geography of Transit

    Rational Transit and Downtown:Transit’s greatest strength is in providing access to the largest downtown areas. These areas have the greatest job densities (jobs per square kilometre) in their metropolitan areas and are typically well served by frequent, rapid and convenient transit service from throughout the metropolitan area. This combination of high employment density and superior transit service attracts one-half or more of all downtown commuters in Canada’s major metropolitan areas to transit (Figure 2). Transit is meets the needs of people who commute to downtown and is the rational choice for many, if not most. However, downtowns contain only a relatively small share (14 per cent) of metropolitan area jobs (Figure 3).

    Rational Personal Mobility Elsewhere: Areas outside downtown lack any such intense concentration of jobs. The area outside downtown, accounting for 6 out of every 7 jobs (Figure 4), maintain much lower employment densities and generally lacks transit service. This is illustrated by the nation’s largest employment center, which surrounds Pearson International Airport in Toronto. Its more than 350,000 employees are spread around an area the size of city of Vancouver (or the city of San Francisco) at a density so low that quick and efficient transit is simply impossible.

    For the overwhelming share of work trips to outside the downtown area, the car does the job and transit accounts for less than 10 percent of commuters. Thus, the automobile is the rational choice for most people who commute to locations outside downtown. And things are not getting better for transit. According to Statistics Canada, employment has been growing much faster outside of downtown than in the high density core areas suited for transit. The 2011 census indicated a continuing dispersion of population as well.


    Transit’s Robust Funding Growth and Declining Productivity

    Strongly Rising Transit Subsidies: Transit subsidies have been growing strongly. According to Transport Canada data, from 1999 to 2008 subsidies grew 83 percent (adjusted for inflation), which is more than three times the 26 percent ridership growth rate and 3.5 times the rate of general inflation. Transit’s declining productivity could indicate a substantial potential for improved cost effectiveness and service expansion within the generous present funding levels.

    Declining Transit Productivity: At the same time, there are concerns about transit productivity. The Conference Board of Canada has documented a 1.2 percent annual decline in productivity for two decades. The same analysis found productivity in other transport sectors to be generally improving. Transit costs have risen well in excess of inflation, service levels and ridership. Rising costs seriously limit transit’s ability to increase its share of travel in metropolitan areas and limits the important role that it is called upon to play in providing door-to-door mobility for the transportation-impaired, such as disabled citizens, the elderly, and students.

    Land Use Strategies that Retard Metropolitan Competitiveness

    Policies that Could Make Metropolitan Areas Less Competitive: While the prospects for improving transit commute times are discouraging, some current land use strategies further increase traffic congestion and lengthen commute times and make metropolitan areas and make metropolitan areas less competitive . Compact cities (also called smart growth) policies have been adopted across Canada in an effort to reduce automobile use and increase urban densities. The planning expectation is that housing should be placed near rail stations. Yet job locations throughout metropolitan areas remain highly dispersed, and with the rise of working at home, are becoming more so. The potential for transit systems (or walking or cycling) to materially impact commuting is very limited in the least.

    International data indicate that higher densities are associated with greater traffic congestion. Further, higher traffic densities are strongly associated with higher levels of air pollution. Improvements in vehicle technology will make reductions in automobile use to reduce greenhouse gas emissions unnecessary, according to U.S. research by McKinsey & Company. Finally, smart growth type policies have been found to retard metropolitan economic growth in the Netherlands, the United Kingdom and the United States (Note 2).

    Improving Metropolitan Competitiveness

    Strategies that reduce commute times can improve metropolitan competitiveness. Expanded telecommuting reduces average commute times by its very nature (though the reported commute times routinely exclude the working at home sector, both in Canada and the US). There are also lessons to be learned from Edmonton and the international metropolitan areas that have been more successful in maintaining shorter commutes: more dispersed employment, lower population densities and a larger share of travel by car (Table 3).

    Table 3
    Comparison of Canadian and U.S. Major Metropolitan Areas
    Average One-way Commute Times and Urban Area Densities
     
    CANADA Canada Metropolitan Areas United States: Metropolitan Area Size Classes
    Commute Time Principal Population Centre Density (per KM2) Average Commute Time Average Principal Population Centre Density (per KM2)
    5,000,000 and Over        
    Toronto 33 2,900 28 1,400
    2,500,000 – 5,000,000        
    Montréal 31 2,200 26 1,200
    1,000,000 – 2,500,00        
    Vancouver 30 1,900 23 1,100
    Ottawa-Gatineau 27 1,900
    Calgary 26 1,600
    Edmonton 23 1,100
    Principal Population Centre: Largest population centre (Statistics Canada term for urban area) in the metropolitan area.


    Focusing on Objectives: To become more competitive, Canada’s metropolitan areas need to improve their average commute times. This requires focusing on strategies that have the highest potential to reduce traffic congestion.

    Residents and businesses in metropolitan areas would be best served by goal-oriented and objective policies squarely directed toward getting people to work faster. The focus should be on what makes commutes shorter, regardless of transport mode, rather than on idealistic notions of how a city should look or how people should travel.

    Wendell Cox is a Visiting Professor, Conservatoire National des Arts et Metiers, Paris and the author of “War on the Dream: How Anti-Sprawl Policy Threatens the Quality of Life”.

    –––

    Note: This article is based upon the recently released Frontier Centre for Public Policy report Improving the Competitiveness of Metropolitan Areas by Wendell Cox, who also serves as a senior fellow at the Centre.

    Note 1: Data not provided for other metropolitan areas.

    Note 2: On a related note, the Bank of Canada (the central bank) and others have indicated a concern about rising house costs relative to incomes. This is to be expected in metropolitan areas adopting green belts, urban growth boundaries and other land rationing policies. Huge housing price increases have occurred in Vancouver, Toronto, Montréal and Calgary (for example), in response to such policies (This is evident from the annual editions of the Demographia International Housing Affordability Survey, sponsored in Canada by the Frontier Centre for Public Policy). The Bank of Canada may be virtually powerless to slow this loss of housing affordability, since its cause (constraining metropolitan land supply) is beyond the reach of the Bank’s monetary policies.

    Photo: Suburban Montreal (by author)

  • The Export Business in California (People and Jobs)

    California Senate President Pro-Tem Darrell Steinberg countered my Wall Street Journal commentary California Declares War on Suburbia in a letter to the editor (A Bold Plan for Sustainable California Communities) that could be interpreted as suggesting that all is well in the Golden State. The letter suggests that business are not being driven away to other states and that the state is "good at producing high-wage jobs," while pointing to the state’s 10 percent growth over the last decade. Senate President Steinberg further notes that the urban planning law he authored (Senate Bill 375) is leading greater housing choices and greater access to transit.

    This may be a description of the California past, but not present.

    Exporting People

    Yes, California continues to grow. California is growing only because there are more births than deaths and the state had a net large influx of international immigration over the past decade. At the same time, the state has been hemorrhaging residents (Figure 1).

    Californians are leaving. Between 2000 and 2009 (Note), a net 1.5 million Californians left for other states. Only New York lost more of its residents (1.6 million). California’s loss was greater than the population of its second largest municipality, San Diego. More Californians moved away than lived in 12 states at the beginning of the decade. Among the net 6.3 million interstate domestic migrants in the nation, nearly one-quarter fled California for somewhere else.

    The bulk of the exodus was from the premier coastal metropolitan areas. Since World War II, Los Angeles, San Francisco, San Diego and San Jose have been among the fastest growing metropolitan areas in the United States and the high-income world. Over the last decade, this growth has slowed substantially, as residents have moved to places that, all things being considered, have become their preferences.

    More than a net 1.35 million residents left the Los Angeles metropolitan area, or approximately 11 percent of the 2000 population. The San Jose metropolitan area lost 240,000 residents, nearly 14 percent of its 2000 population. These two metropolitan areas ranked among the bottom two of the 51largest metropolitan areas (over 1,000,000 population) in the percentage of lost domestic migrants during the period. The San Francisco metropolitan area lost 340,000 residents, more than 8 percent of its 2000 population and ranked 47th worst in domestic migration (New York placed worse than San Francisco but better than Los Angeles). Each of these three metropolitan areas lost domestic migrants at a rate faster than that of Rust Belt basket cases Detroit, Cleveland and Buffalo.

    San Diego lost the fewest of the large coastal metropolitan areas (125,000). Even this was double the rate of Rust Belt Pittsburgh.

    Exporting Jobs

    California is no longer an incubator of high-wage jobs. The state lost 370,000 jobs paying 25 percent or more of the average wage between 2000 and 2008. This compares to a 770,000 increase in the previous 8 years. California is trailing Texas badly and the nation overall in creating criticial STEM jobs and middle skills jobs (Figures 2 & 3) Only two states have higher unemployment rates than California (Nevada and Rhode Island) . California has the second highest underemployment rate (20.8 percent), which includes the number of unemployed, plus those who have given up looking for work ("discouraged" workers) and those who are working only part time because they cannot find full time work. Only Nevada, with its economy that is overly-dependent on California, has a higher underemployment rate.


    Business relocation coach Joseph Vranich conducts an annual census of companies moving jobs out of California and found a quickening pace in 2012. Often these are the very kinds of companies capable of creating the high-wage jobs that used to be California’s forte. Vranich says that the actual number may be five times as high, which is not surprising, not least because there is no reliable compilation of off-shoring of jobs to places like Bangalore, Manila or Cordoba (Argentina).

    To make matters worse, California is becoming less educated. California’s share of younger people with college degrees is now about in the middle of the states, while older, now retiring Californians are among the most educated in the nation (Figure 4).

    Denying Housing Choice

    It is fantasy to believe, as Steinberg claims, that there are enough single family (detached) houses in the state to meet the demand for years to come. More than 80 percent of the new households in the state chose detached housing over the last decade. People’s actual choices define the market, not the theories or preferences of planners often contemptuous of the dominant suburban lifestyle.

    In contrast, however, the regional plans adopted or under consideration in the Bay Area, Los Angeles and San Diego would require nearly all new housing be multi-family, at five to 10 times normal California densities (20 or more units to the acre are being called for). New detached housing on the urban fringe would be virtually outlawed by these plans. And, when Sacramento does not find the regional plans dense enough, state officials (such as the last two state Attorneys General) are quick to sue. If the "enough detached housing" fantasy held any water, state officials and planners would not be seeking its legal prohibition. To call outlawing the revealed choice of the 80 percent (detached housing) would justify the equivalent of a Nobel Prize in Doublespeak.

    At the same time by limiting the amount of land on which the state preferred high density housing must be built, land and house prices can be expected to rise even further from their already elevated levels (already largely the result of California’s pre-SB 375 regulatory restrictions).

    Transit Rhetoric and Reality

    Transit is important in some markets. About one-half of commuters to downtown San Francisco use transit. The assumptions of SB 375 might make sense if all of California looked like downtown San Francisco. It doesn’t, nor does even most of the San Francisco metropolitan area. Only about 15 percent of employment is downtown, while the 85 percent (and nearly all jobs in the rest of the state) simply cannot be reached by transit in a time that competes with the car. Even in the wealthy San Jose area (Silicon Valley), with its light rail lines and commuter rail line, having a transit stop nearby provides 45 minute transit access to less than 10 percent of jobs in the metropolitan area.

    A recent Brookings Institution report showed that the average commuter in the four large coastal metropolitan areas can reach only 6.5 percent of the jobs in a 45 minute transit commute. This is despite the fact that more than 90 percent of residents can walk to transit stops. Even when transit is close, you can’t get there from here in most cases in any practical sense (Figure 5).

    SB 375 did little to change this. For example, San Diego plans to spend more than 50 percent of its transportation money on transit over the next 40 years. This is 25 times transit’s share of travel (which is less than 2 percent). Yet, planners forecast that all of this spending will still leave 7 out of 8 work and higher education trips inaccessible by transit in 30 minutes in 2050. Already 60 to 80 percent of work trips in California are completed by car in 45 minutes and the average travel time is about 25 minutes.

    For years, planners have embraced the ideal of balancing jobs and housing, so that people would live near where they work, while minimizing travel distances. This philosophy strongly drives the new SB 375 regional plans. What these plans miss is that people choose where to work from the great array of opportunities available throughout the metropolitan area. These varied employment opportunities that are the very reason that large metropolitan areas exist, according to former World Bank principal planner Alain Bertaud.

    People change jobs far more frequently than before and multiple earners in households are likely to work far apart. Similar intentions led to the development up to four decades ago of centers like Tensta in Stockholm, which ended up as concentrated low income areas (Photo). It California, such a concentration would do little to improve transit ridership, even low-income citizens are four to 10 times as likely use cars to get to work than to use transit.


    Tensta Transit Oriented Development: Stockholm

    All of this means more traffic congestion and more intense local air pollution, because higher population densities are associated with greater traffic congestion. Residents of the new denser housing would face negative health effects because there is more intense air pollution, especially along congested traffic corridors.

    Self-Inflicted Wounds

    Worst of all, California’s radical housing and transportation strategies are unnecessary. The unbalanced and one-dimensional pursuit of an idealized sustainability damages both quality of life and the economy. This is exacerbated by other issues, especially the state’s dysfunctional economic and tax policies. It is no wonder California is exporting so many people and jobs. California’s urban planning regime under SB 375 is poised to make it worse.

    Wendell Cox is a Visiting Professor, Conservatoire National des Arts et Metiers, Paris and the author of “War on the Dream: How Anti-Sprawl Policy Threatens the Quality of Life”.

    Net Domestic Migration: 2000-2009
    Rank Metropolitan Area Net Domestic Migration Compared to 2000 Population
    1 Raleigh, NC         194,361 24.2%
    2 Las Vegas, NV         311,463 22.4%
    3 Charlotte, NC-SC         248,379 18.5%
    4 Austin, TX         234,239 18.5%
    5 Phoenix, AZ         543,409 16.6%
    6 Riverside-San Bernardino, CA         469,093 14.3%
    7 Orlando, FL         225,259 13.6%
    8 Jacksonville, FL         126,766 11.3%
    9 Tampa-St. Petersburg, FL         260,333 10.8%
    10 San Antonio, TX         177,447 10.3%
    11 Atlanta, GA         428,620 10.0%
    12 Nashville, TN         123,199 9.4%
    13 Sacramento, CA         141,117 7.8%
    14 Richmond, VA           75,886 6.9%
    15 Portland, OR-WA         121,957 6.3%
    16 Dallas-Fort Worth, TX         317,062 6.1%
    17 Houston, TX         243,567 5.1%
    18 Indianapolis. IN           72,517 4.7%
    19 Oklahoma City, OK           41,082 3.7%
    20 Denver, CO           66,269 3.0%
    21 Louisville, KY-IN           34,381 3.0%
    22 Birmingham, AL           26,934 2.6%
    23 Columbus, OH           34,204 2.1%
    24 Kansas City, MO-KS           31,747 1.7%
    25 Seattle, WA           40,741 1.3%
    26 Minneapolis-St. Paul, MN-WI          (19,731) -0.7%
    27 Memphis, TN-MS-AR            (8,583) -0.7%
    28 Hartford, CT            (9,349) -0.8%
    29 Cincinnati, OH-KY-IN          (17,648) -0.9%
    30 Virginia Beach-Norfolk, VA-NC          (20,005) -1.3%
    31 Baltimore, MD          (36,407) -1.4%
    32 St. Louis, MO-IL          (43,750) -1.6%
    33 Philadelphia, PA-NJ-DE-MD        (115,890) -2.0%
    34 Pittsburgh, PA          (52,028) -2.1%
    35 Washington, DC-VA-MD-WV        (107,305) -2.2%
    36 Providence, RI-MA          (49,168) -3.1%
    37 Salt Lake City, UT          (34,428) -3.5%
    38 Rochester, NY          (40,219) -3.9%
    39 San Diego, CA        (126,860) -4.5%
    40 Buffalo, NY          (55,162) -4.7%
    41 Milwaukee,WI          (74,453) -5.0%
    42 Boston, MA-NH        (235,915) -5.4%
    43 Miami, FL        (287,135) -5.7%
    44 Chicago, IL-IN-WI        (561,670) -6.2%
    45 Cleveland, OH        (136,943) -6.4%
    46 Detroit,  MI        (366,790) -8.2%
    47 San Francisco-Oakland, CA        (347,375) -8.4%
    48 New York, NY-NJ-PA     (1,962,055) -10.7%
    49 Los Angeles, CA     (1,365,120) -11.0%
    50 San Jose, CA        (240,012) -13.8%
    51 New Orleans, LA        (301,731) -22.9%
    Data from US Census Bureau


    —–

    Note:  2000 to 2010 data not available

    Lead photo: Largely illegal to build housing under California Senate Bill 375 planning

  • California Declares War on Suburbia II: The Cost of Radical Densification

    My April 9 Cross Country column commentary in The Wall Street Journal (California Declares War on Suburbia) outlined California’s determination to virtually outlaw new detached housing. The goal is clear:    force most new residents into multi-family buildings at 20 and 30 or more to the acre. California’s overly harsh land use regulations had already driven housing affordability from fairly typical levels to twice and even three times higher than that of much of the nation. California’s more recent tightening of the land use restrictions (under Assembly Bill 32 and Senate Bill 375) has been justified as necessary for reducing greenhouse gas (GHG) emissions.

    It is All Unnecessary: The reality, however, is that all of this is unnecessary and that sufficient GHG emission reductions can be achieved without interfering with how people live their lives. As a report by the McKinsey Company and The Conference Board put it, there would need to be "no downsizing of vehicles, homes or commercial space," while "traveling the same mileage." Nor, as McKinsey and the Conference Board found, would there be a need for a "shift to denser urban housing." All of this has been lost on California’s crusade against the lifestyle most Californians households prefer.

    Pro and Con: As is to be expected, there are opinions on both sides of the issue. PJTV used California Declares War on Suburbia as the basis for a satirical video, Another Pleasant Valley Sunday, Without Cars or Houses? Is California Banning Suburbia?

    California’s Increasing Demand for Detached Housing? A letter to the editor in The Wall Street Journal suggested that there are more than enough single-family homes to accommodate future detached housing demand in California for the next 25 years. That’s irrelevant, because California has no intention of allowing any such demand to be met.

    The data indicates continuing robust demand. In California’s major metropolitan areas, detached houses accounted for 80 percent of the additions to the occupied housing stock between 2000 and 2010, which slightly exceeds the national trend favoring detached housing (Figure 1). If anything, the shift in demand was the opposite predicted by planners, since only 54 percent of growth in occupied housing in the same metropolitan areas was detached in 2000 (Figure 2).


    Watch What they Do, Not What they Say: It does no good to point to stated preference surveys indicating people preferring higher density living. Recently, Ed Braddy noted in newgeography.com (Smart Growth and the New Newspeak) that a widely cited National Association of Realtors had been "spun" to show that people preferred higher density living, from a question on an "unrealistic scenario," and ignoring an overwhelming preference for detached housing – roughly eighty percent – in other questions in the same survey. People’s preferences are not determined by what they say they will do, but rather by what they do.

    Off-Point Criticism: There was also "off-point" criticism, which can be more abundant than criticisms that are "on-point." Perhaps the most curious was by Brookings Institution Metropolitan Policy Program Senior Researcher Jonathan Rothwell (writing in The New Republic) in a piece entitled "Low-Density Suburbs are Are Not Free-Market Capitalism." I was rather taken aback by this, since none of these three words ("free," "market" or "capitalism") appeared in California Declares War on Suburbia. I was even more surprised at the claim that I defend "anti-density zoning and other forms of large lot protectionism." Not so.

    Indeed, I agree with Rothwell on the problems with large lot zoning. However, it is a stretch to suggest, as he does, that the prevalence of detached housing results from large lot zoning. This is particularly true in places like Southern California where lots have historically been small and whose overall density is far higher than that of greater New York, Boston, Seattle and double that of the planning mecca of Portland.

    Rothwell’s own Brookings Institution has compiled perhaps the best inventory of metropolitan land use restrictions, which indicates that the major metropolitan areas of the West have little in large lot zoning. Yet detached housing is about as prevalent in the West as in the rest of the nation (60.4 percent in the West compared to 61.9 percent in the rest of the nation, according to the 2010 American Community Survey). Further, there has been little or no large lot zoning in Canada and Australia, where detached housing is detached, nor in Western Europe and Japan (yes, Japan, see the Note below).  

    On-Point: Urban Growth Boundaries Do Increase House Prices: However, to his credit, Rothwell points out the connection between urban growth boundaries and higher house prices. This is a view not shared by most in the urban planning community, who remain in denial of the economic evidence (or more accurately, the economic principle) that constraining supply leads to higher prices. This can lead to disastrous consequences, as California’s devastating role in triggering the Great Recession indicates.

    The Purpose of Urban Areas: From 1900 to 2010, the urban population increased from 40 percent to 80 percent of the US population. Approximately 95 percent of the population growth over 100 years was in urban areas. People did not move to urban areas the cities for "togetherness" or to become better citizens. Nor did people move out of an insatiable desire for better urban design or planning. The driving force was economic: the desire for higher incomes and better lives. A former World Bank principal urban planner, Alain Bertaud stated the economic justification directly: "large labor markets are the only raison d’être of large cities."

    And for the vast majority of Americans in metropolitan areas, including those in California, those better lives mean living in suburbs and detached houses. All the myth-making in the world won’t change that reality, even if it pushes people out of the Golden State to other, more accommodating pastures.

    The performance of urban areas is appropriately evaluated by results, such as economic outcomes, without regard to inputs, such as the extent to which an area conforms to the latest conventional wisdom in urban planning.

    • Land use policies should not lead to higher housing costs relative to incomes, as they already have in California, Australia, Vancouver, Toronto and elsewhere. If they do, residents are less well served.
    • Transport policies should not be allowed to intensify traffic congestion by disproportionately funding alternatives (such as transit and bicycles) that have little or no potential to improve mobility as seems the likely outcome of radical densification. If they do, residents will be less well served.

    This gets to the very heart of the debate. The “smart growth on steroids” policies now being implemented in California are likely to lead to urban areas with less efficient personal and job mobility, where economic and employment growth is likely to be less than would otherwise be expected. The issue is not urban sprawl. The issue is rather sustaining the middle-income quality of life, which is now endangered by public policy in California, and for no good reason.

    Wendell Cox is a Visiting Professor, Conservatoire National des Arts et Metiers, Paris and the author of “War on the Dream: How Anti-Sprawl Policy Threatens the Quality of Life

    —-

    Note: Despite its reputation for high density living, Japan’s suburbs have many millions of detached houses. In 2010, 47 percent of the occupied housing in Japan’s major metropolitan areas was detached (Tokyo, Osaka-Kobe-Kyoto, Nagoya, Sapporo, Sendai, Hiroshima, Kitakyushu-Fukuoka, Shizuoka and Hamamatsu).

    Photo: An endangered species: Detached houses in Ventura County (Photo by author)

  • Transportation Aborted

    Like most Americans, I was bombarded by sound-bites and blog-bytes surrounding an amendment to an Act of Congress that would require a woman to submit to and review the results of a trans-vaginal ultrasound before receiving an abortion. This amendment was covered ad nauseam by everyone from the Huffington Post to the nightly news on broadcast television. I don’t mind admitting that I’m past the age where this Act of Congress would have an effect on me personally.

    What really bothered me was that no one talked about the core problem of how deranged our political process has become in Washington. The real issue here that impacts all of us is that this amendment was attached to a transportation funding bill – TRANSPORTATION, not a Health Care Bill or a Health Insurance Bill or even an Equal Opportunity Employment Bill but a TRANSPORTATION funding bill.

    All of these journalists are as at fault over the issue as the bunch of Congressmen who tried – once again – to slip one past the balance of powers and our democratic form of government. The guilty parties in Washington DC start with:

    In the House of Representatives, Mr. Fortenberry (NE), Mr. Boren (OK), Mrs. McMorris Rodgers (WA), Mr.Scalise (LA), Mr. Tiberi (OH), Mr. CONAWAY (TX), Mr. Lamborn (CO), Mr. Walberg (MI), and Mr. Lipinski (IL) who introduced  “H.R.1179 — Respect for Rights of Conscience Act of 2011” on March 17, 2011. By the time the bill was attached as an amendment to the highway funding bill, the number of co-sponsors had risen from 8 to 221.

    In the Senate, Mr. Blunt (MO), Mr. Rubio (FL), and Ms. Ayotte (NH)) introduced S. 1467 on August 2, 2011. The cosponsors in the Senate went from 2 to 37.

    That’s a total of 260 elected representatives who will be responsible for the continuing deterioration of highway infrastructure in the United States. The current Federal authorization for funding surface transportation programs ends March 30, 2012.

    The current funding authorization is just the most recent in a long line of temporary extensions that have been strung together since the last 5-year plan expired in 2009. The highway funding bill in question – to which this healthcare amendment is being attached – would authorize funding of $109 billion over 2 years. If nothing is done by March 30, if no action is taken to fund US highway infrastructure, the Department of Transportation (DoT) will have to furlough workers and stop paying contractors, according to Humberto Sanches of Roll Call. Last summer, DoT sent home 4,000 FAA employees and 70,000 private-sector workers because Congress failed to act on funding.

    The process for highway funding is already convoluted and inefficient – watching the current Congress add abortion amendments to the funding bill gives us a peek into how it got that way. In the meantime the United States’ infrastructure is crumbling and the rest of the world is getting ahead of us. No wonder we’re deranged.

  • The Sorry State of American Transport

    We constantly read about the infrastructure crisis in America. I’ll have more to say on this at a future date, but it is pretty clear that we need to spend more money in a whole lot of areas: airports, roads and bridges, public transportation, and more.

    Yet it’s very easy to see that so much of what ails transport has nothing to do with a lack of funds and everything to do with a lack of will. I took a train ride on the Northeast corridor last week that really drove it home to me.

    Start with the sorry state of Penn Station in New York City, America’s busiest train station. (In fact, it’s the busiest transportation facility of any type in the United States, if Wikipedia can be believed). Yes, the place is a depressing underground dump. Yes, there used to be a glorious train station there that was demolished in the 1960s. Yes, we probably need to invest many billions in upgrades.

    Yet is it a lack of funds that make the three agencies that call it home – Amtrak, New Jersey Transit, and the Long Island Railroad – act as though the others don’t exist? The three railroads have completely separate ticketing areas, signage systems, etc. This is hardly the only case in America. For some reason, Amtrak seems to despise sharing ticket agents with other carriers. There are separate windows for Amtrak and commuter lines everywhere I’ve been. Given that many journeys include both commuter and inter-city segments, this seems crazy. If you can’t have integrated ticketing (and actually, I don’t see why you can’t), at least you should be able to have a single agent help you.

    The worst example of this I know is in Providence, where Amtrak monopolizes the four ticket windows. If you want to buy an MBTA T ticket, you have to go to a cafe next door. This tiny little coffee shop found a way to sell both pastries and train tickets (albeit from separate registers), so why can’t Amtrak figure out how to sell two kinds of tickets?

    Also, as near as I can tell, there’s no way to actually get your Amtrak ticket online. You can book a reservation, but then you need to get a physical ticket printed at the station, either from a kiosk or an agent. (If there’s a way to avoid this, please let me know).

    I decided to get my ticket at the window. The line was very short and I was early in any case. When I got there, some guy with his kids was at the window screaming at the agent about a problem with their tickets. I chalked this up to one of those cases where the frustrations of travel just cause somebody to snap. But then as I walked up to the window, the person next to me was also having a similar problem with their ticket and was having an animated discussion with an agent who didn’t seem to care. Fortunately, I had no such issues, but the agent I had to talk to was extremely surly and kept asking me to repeat myself over and over. Who would want to put themselves through such an experience? Customer service is clearly something that should also be within Amtrak’s control.

    Amtrak markets themselves as having wi-fi. But on the train itself, as anyone who has ridden the NEC knows, the wi-fi is basically unusable. How much capital investment would it take to get working wi-fi?

    In short, though the facilities can somewhat be excused as resulting from insufficient capital funding and bad decisions decades ago, there’s so much that could be done right now to upgrade the passenger experience it’s not even funny.

    It’s the same with airports. While a few American cities like Indianapolis and Detroit have upgraded their terminals, too many key gateways remain depressingly dreary and non-functional. While some overseas places like Heathrow certainly would give any American airport a run for its money in the Hall of Shame, the general experience of flying to someplace like Madrid, Singapore, or Tokyo is like night and day versus the US.

    Key among the worst offenders again is New York City, especially LaGuardia. Matt Chaban at the New York Observer recently wrote a piece that is a good overview of the depressing state: “Terminal Condition – How New York’s Airports Crashed and Burned.”

    This is certainly not news to anyone who has flown to New York. But again, the vast billions it would take to replace these decrepit facilities is only part of the problem. Nobody forces America to put its passengers through the “TSA experience.” Last time I flew I was delayed at security while agents patted down some guy that looked like he was around 85 years old who apparently hadn’t stripped down quite far enough to go through the full body scanner. Somehow other advanced nations manage to run safe air travel systems without resorting to this.

    While we are waiting around for funding issues to be resolved, wouldn’t it be nice if our governments and various travel companies actually focused on fixing some of these straightforward problems with coordination, ticketing, and customer service? It’s hard to take their capital requests seriously if they aren’t going to do what they can now.

    Aaron M. Renn is an independent writer on urban affairs based in the Midwest. His writings appear at The Urbanophile.

    Photo By Kyle Gradinger, Amtrak Keystone Snowstorm I. Amtrak AEM-7 locomotive 904 leads a Keystone Corridor train through the snow in Rebel Hill, King of Prussia, PA.