Tag: Transportation

  • Honolulu’s Money Train

    Honolulu is set to construct an ambitious urban rail project. It’s a $5.125 billion behemoth that this metropolitan area with less than a million residents may not be able to afford.

    Honolulu’s Beleaguered Residents

    Critically, there is plenty of competition for the scarce dollars that Honolulu residents have to spare. The city’s basic infrastructure is in bad shape.

    (Sewer) Water, Water Everywhere: A consent decree signed between local officials and the Environmental Protection Agency requires major upgrades to the sewer system. Sewer overflows are not unusual. Just a few days ago, 51,000 gallon raw sewage spilled into a local stream. The state issued a brown water alert for the entire island of Oahu (which is also the combined city and county of Honolulu), including Waikiki Beach and all other beaches. As of this writing, the brown water advisory has not been cancelled. Just in the last year, the state has reported 17 sewage spills and four brown water alerts. For this to happen in a highly tourist dependent economy is nothing short of astounding.

    More than Leaky Pipes: The city’s water system is in need of major upgrades. From 2004 to 2009, water main breaks were virtually a daily occurrence. In an effort to solve the problem, the city has raised water rates 60 percent in the last five years and plans another 70 percent increase over the next five years. How much more will be required after that is anyone’s guess. "How are people going to make it? I just don’t know" reacted City council Budget Chair Ann Kobayashi.

    Unfunded Government Employee Liabilities: In just three years, unfunded city and county employee pension and retiree benefits have risen from $15,000 to $21,000 per Honolulu household. The state’s actuarial consultant says things are going to get worse. The demographics are skewed against financial control, since people are living longer, and the number of retirees is rising relative to the workers who must pay (most of whom cannot even dream of such rich benefits).   All of this means higher tax bills for Honolulu households.

    High Cost of Housing, High Cost of Living: Honolulu residents already endure the most unaffordable housing  in the nation, with median house prices 8.7 times median household incomes. That is three times Dallas-Fort Worth.  Honolulu’s overall cost of living is also the highest in the nation, outside six metropolitan areas in the greater New York and San Francisco Bay Areas. Honolulu residents pay $1.41 to buy what $1.00 buys in St. Louis, 1.24 for each $1.00 in Austin and $1.21 for each $1.00 in Phoenix.

    Choices: This is not about easy choices. The sewer remediation, water system maintenance, government employee pension and government employee retiree health care benefits are mandatory. The rail expenditures are not.

    The Rickety Rail Project

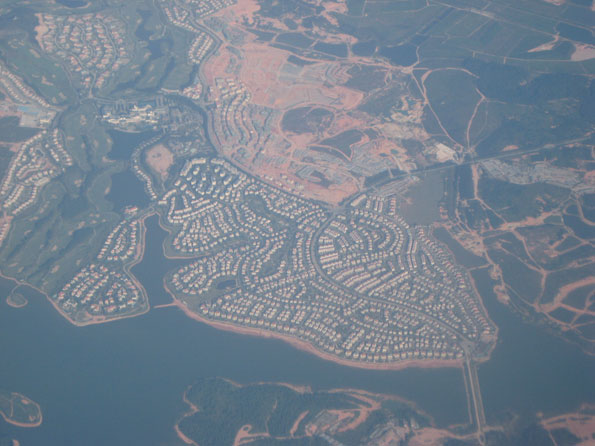
    Yet the city of Honolulu would tax its residents even more to pay for a 20 mile rail line to empty farmland well beyond the urban fringe. This is a project not unlike the early 1900s land speculation schemes of Henry Huntington in Los Angeles and the Sweringens of Shaker Heights (Cleveland). There is, however, one important difference. The Huntington and the Swearingens bet their own money. Honolulu is betting the money of its taxpayers.


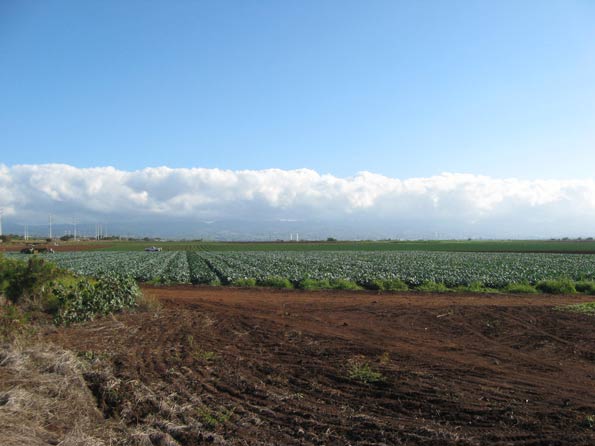
    End of the Honolulu Rail Line

    The city hopes to receive $1.55 billion from the federal government, with local residents left to pay a hefty 70 percent of the cost. This $3.575 billion local share would create the highest tax burden for any urban rail line ever built in the nation, at more than $10,000 per household. But residents should "thank their lucky stars" if that’s all they have to pay, given the history of cost overruns on such projects around the world.

    Stacking the Deck: The Federal Court Challenge: The planning process is being challenged in federal court. The plaintiffs argue that the rail selection process eliminated more cost effective options with biased analysis. This would not be the first time.

    Annie Weinstock, Walter Hook, Michael Replogle, and Ramon Cruz of the Institute for Transportation Development and Policy (with a foreword by Oregon Congressman Earl Blumenaur),  cited circuitous routing of a busway that biased ridership forecasts in favor of light rail for the suburban Washington Purple Line. Weinstock, Hook, Repogle and Cruz refer to a similar "deck stacking technique" that favored an expensive rail project over a busway in the suburban Washington Dulles corridor. They fault local officials more than federal:

    While there is no outright pro-rail bias at the FTA, there is indeed FTA complicity in the rail bias of city and state level mass transit project sponsors. The FTA, when evaluating New Starts and Small Starts project applications, tends to bow to political pressure to favor locally preferred alternatives and ignore certain forms of rail bias by the project sponsors

    Pulling the Plug on Rail? Former Governor Ben Cayatano has filed to run against Mayor Carlisle in the August 2012 election. In announcing his entry, Governor Cayatano said "I will pull the plug on rail." Polls show Mr. Cayetano ahead of both Mayor Carlisle and a third candidate.

    Capital Cost Escalation: A state report indicated that construction costs could rise well above forecast. Every penny above the $5.125 billion capital cost will be the responsibility of local taxpayers. Based upon the international experience, this could easily raise the per household cost from $15,000 to $20,000.

    Ridership Optimism Bias: Echoing general concerns raised by Weinstock, Hook, Repogle and Cruz (above), the state report indicated concern over an optimism bias in the ridership projections. For example, the city expects 60 percent of rail riders to use the bus to get to the train.  This is four times the rate of the largest new rail system built in the nation (Washington’s Metro).  Using the bus to connect to the train makes travel much slower and this factor has often been over-estimated by rail planners. This unrealistic assumption alone could qualify the Honolulu ridership forecast as among the most inaccurate in history.  Fewer riders. more money out of residents pockets.

    A Billion Here, A Billion There: As if all of this were not enough, a report for the Federal Transit Administration, obtained by the Star Advertiser through a freedom of information request, indicates that the operating costs of the transit system may be understated by as much as $1 billion over the next 20 years. That’s $3,000 per Honolulu household (Note 1).

    Federal Doubts: Federal Transit Administration Regional Administrator Leslie Rogers expressed concern about Honolulu’s ability to afford the project in a letter to local officials, noting that the funding program is insufficient. Local taxpayers likely will need to pony up more.

    Debt Limit Suspended: After having claimed it could afford the rail debt, the city suspended its debt limit — a fact discovered four months after the fact by the Star Advertiser.  Usually, breaches of trust like this become evident only much later in the rail construction process. A suspended debt limit means more money out of taxpayer pockets, or worse. Jefferson County, Alabama filed bankruptcy after not being able to afford payments on its sewer debt.

    How Would Rail Change Honolulu

    With rail, Honolulu there are two ways that Honolulu will be changed:

    What Will Change: Walling Off the Waterfront. The elevated design of the rail system is so intrusive that the local chapter of the American Association of Architects opposes the proposal. The elevated line would run directly in front of the waterfront. Its oppressive design would separate the rest of the historic Aloha Tower area from the rest of the city and could preclude future attractive "placemaking" development (see lead photo, courtesy of the Honolulu Chapter of the American Institute of Architects).

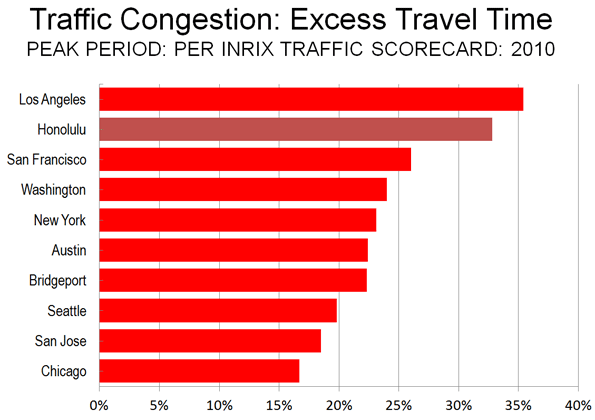
    No Traffic Relief: Despite being only the 52nd largest metropolitan area in the nation, Honolulu has the second worst traffic congestion in the nation (see figure), according to INRIX, the leading international reporting source. Honolulu and Los Angeles are the only US metropolitan areas ranked in the worst 25 out of 200 in Western Europe and the United States. Even with the rail system, local plans call for traffic congestion to get worse.

    Getting the Choices Right

    Incumbent Mayor Peter Carlisle recently returned from a Potemkin Village tour of Manila, raving about that city’s rail system. Governor Cayateno, whose familiarity with Manila extends well beyond a scripted tour, called Mayor Carlisle’s comparison with Manila "comedic," noting that most residents cannot afford a car or that Manila has more than 10 times as many people.  


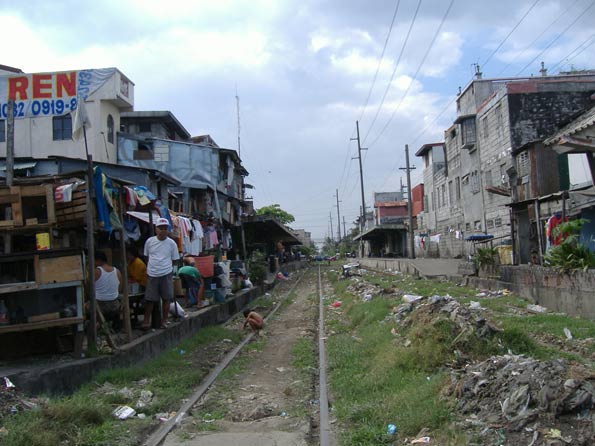
    Manila Rail System: Part the Mayor Did not See

    The mayor may not have been aware that more than 4,000,000 – more than one-third – of Manila’s (National Capital Region) residents live in slums, shantytowns and informal settlements, where sewers are rare if not non-existent. Government projections indicate that the slum population will rise to 9,000,000 by 2050. More than one-half of Manila’s population will be in slums.
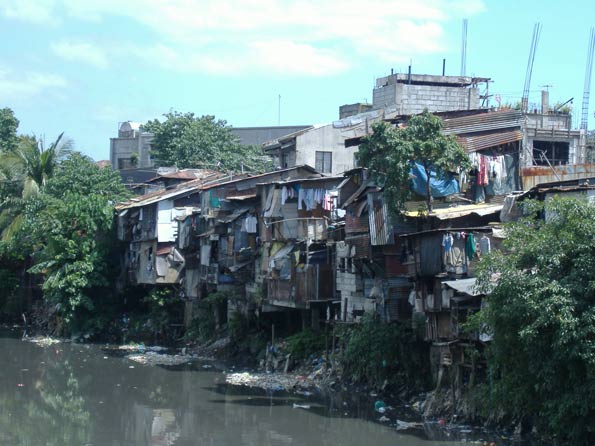

    Manila Slum

    In his recent "state of the city’" address, Mayor Carlisle mused "Manila without rail transit would be unthinkable." That may be the view of an itinerate visitor, but not of the majority who never ride it. For millions, a Manila with sewers is unimaginable. First world urban areas all have sewers. But many do not have rail systems. Honolulu could use some genuine prioritization and less contempt for the hard earned income of its residents.

    Wendell Cox is a Visiting Professor, Conservatoire National des Arts et Metiers, Paris and the author of “War on the Dream: How Anti-Sprawl Policy Threatens the Quality of Life

    —–

    Note 1: Illinois Senator Everett McKinley Dirksen, who was minority leader of the United States Senate in the 1960s is reported to have said: "A million here, a million there, pretty soon, you’re talking real money." The line has been often repeated, though the rise in government spending is indicated by the inflation from "millions" to "billions."

    Note 2: Manila’s rail system serves a very small market and represents a small share of transit ridership. The latest available data suggested that barely five percent of transit ridership was on rail.

    Top Photo: Visual of rail system in downtown Honolulu (courtesy of American Institute of Architects, Honolulu Chapter) 

    Photo credits: All others by author

  • Commuting in New York City, 2000-2010

    New York City is infamous for congestion and long commutes. At 34.6 minutes, it has the longest average commute time in the United State. The region is also America’s top user of public transportation, with 30.7% of all metro area commutes made by transit. Nearly 40% of all transit commuters in the United States are in the metro New York. As transit commutes generally take longer than driving, one might be tempted to link these facts. But commute times also seem to correlate with city size, and bedevil big cities with limited public transit too.

    New York’s commutes improved a bit over the 2000s, however. The average commute time declined in every borough, in the city as a whole, and in the region. Overall US commute times fell as well, but less than New York’s:


    Source: Census 2000, American Community Survey 2010 1-yr

    In addition to showing the decline, this chart also highlights disparity in commute times between the subareas of New York. Manhattanites have far shorter commutes than those who live in the outer boroughs. In fact, the outer boroughs actually have longer commutes than far-flung outer suburban areas. The areas just outside the urban core of New York are some of the most disadvantaged for regional commuting

    The commute time decline is particularly noticeable when looking at ultra-long commutes, those that are 90 minutes are longer:


    Source: Census 2000, American Community Survey 2010 1-yr

    Here again we see both a decline in long commutes and a higher concentration in the outer boroughs.

    New York also managed to finish out the decade with no increase in traffic congestion. According to the Texas Transportation Institute, the region ended the decade with the same Travel Time Index it had when it started, 1.28:


    Source: Texas Transportation Institute, Urban Mobility Report 2011

    What has caused this?  Firstly, given that the data is collected in surveys with a margin of error, one shouldn’t read too much into any given year’s value. However, the decline was fairly consistently reflected in the later decade surveys and doesn’t appear to be an anomaly of just 2010.

    Assuming some legitimate improvement, one obvious potential explanation is the economy. Metro New York did lose 99,000 jobs in the 2000s. This was only a decline of 1.2% however, which actually bettered the US as a whole. But given the extreme congestion in the region, it clearly could have played a role. Also not to be dismissed are toll increases in the regions, and even potentially changes resulting from 9/11.

    Given the focus of the Bloomberg administration on non-auto forms of transportation, it is also worth looking at changes there.  Public transit usage grew strongly in New York over the decade, with regional trips increasing by 23%.


    Source: Texas Transportation Institute Urban Mobility Report 2011

    This increase is also reflected  an increase in public transportation commuting mode share over the past decade.


    Source: Census 2000, American Community Survey 2010 1-yr

    So should increased public transit ridership get the credit for commute time reductions? To some extent perhaps. But remember that New York has both the nation’s longest commutes and highest public transit ridership. Also keep in mind that public transit commutes are longer than driving commutes. The average commute time in metro New York for those driving alone is 30 minutes. For those riding public transportation it is 51.2 minutes. But transit riders affect drivers too. Public transit saves drivers in the New York area nearly $8 billion per year in congestion costs.  So while public transit can’t be necessarily given the credit for commute time improvements, it’s certainly possible it contributed to them .

    The same is not true, however, for other alternative transport modes. Here is the change in bicycle commuting over the decade:


    Source: Census 2000, American Community Survey 2010 1-yr

    Bicycling gets a lot of press in New York, and while the increases look impressive on a chart like the one above, the reality is that this is a trend that enjoys only a bit more than half a percentage point gain in mode share. Bicycling may be on an upswing, and may be of great help recreationally and for non-commute trips, but it is not yet a major force in commuting.

    Walking is actually far more prevalent than bicycling for commuting in New York. But the mode share for walking actually declined over the decade:


    Source: Census 2000, American Community Survey 2010 1-yr

    While walking is generally seen as a good thing in urbanist circles, some people can end up walking to work simply because they have no other alternatives. People who obtain access to a car, or who are able to use transit to get a job outside of their neighborhood, may in fact be improving their economic prospects. Some people who previously walked may be riding transit or biking to work today. Also, some walkers may have switched to driving. Interestingly, the number of households without a vehicle declined in metro New York, though some boroughs saw increases. The changes are very small, however.


    Source: Census 2000, American Community Survey 2010 1-yr

    Lastly, as you might expect with transit going up, the percentage of commuters driving alone declined nearly across the board in New York, though it increased nationally:


    Source: Census 2000, American Community Survey 2010 1-yr

    In short, New York retains America’s longest commutes and highest public transport usage. But in the last decade there have been increases in public transport commuting and declines in people driving alone, while overall commute times have improved, fewer people with ultra-long commutes, and road congestion has stayed flat. The 2000s were perhaps an unusual decade in America and New York. And the changes are fairly small so far.  The future will tell whether this is the start of a long term trend or merely a short term reversal.

    Aaron M. Renn is an independent writer on urban affairs based in the Midwest. His writings appear at The Urbanophile. Telestrian was used to analyze data and to create maps for this piece.

  • The White House Transportation Re-authorizaion: An “Unserious” Proposal

    The Administration’s $476 billion six-year transportation reauthorization proposal —included as part of its FY 2013 budget submission —has met with indifference if not outright skepticism in the transportation community. For one thing, the proposal comes at a time when both houses of Congress have already developed and are actively pursuing their own versions of reauthorization legislation. For another thing, the White House proposal is a close replica of the FY 2012 reauthorization proposal — a proposal that had been soundly rejected last year by the Republican House and the Democratic-controlled Senate alike. Lastly, the White House proposal is viewed –both in its levels of spending and its approach to funding — as totally disconnected from political reality The New York Times called it “more a campaign document than a legislative proposal.”

    The six-year budget provides a total of $305 billion for highways, $108 billion for transit and $47 billion for high-speed rail. It calls for an average funding level of $79 billion/year — almost double the $40-42 billion/year proposed in the House and Senate reauthorization bills.

    The total spending authority over six years would exceed the expected revenues by $231 billion. To offset this deficit, the Administration proposes to use “savings” achieved from “reduced Overseas Contingency Operations”— bureaucratic jargon for ending military operations in Iraq and Afganistan. Such offsets have been dismissed as “an accounting gimmick,” “imaginary” and “meaningless” by both Republicans and Democrats on the Senate Budget committee during recent hearings on the Administration’s bill.

    The White House has not helped itself by announcing that “After the six-year reauthorization period, the Administration is committed to working with the Congress on a financing mechanism.” (p.158 of the DOT budget). In effect, the White House is saying, Let the next Administration figure out how to pay for the program. For our part, let’s just pretend it’s paid for with an imaginary “peace dividend” from ramping down overseas military operations.

    Senate Minority Leader Mitch McConnel (R-KY) has called the FY 2013 budget submission “so unserious and political that even members of the President’s own party don’t want to have anything to do with it.” Sen. Jeff Sessions (R-AL), the Budget Committee’s ranking member, described the proposal as “not connected to reality.” Few Congressional aides we have talked to had anything charitable to say about it. In sum, the White House reauthorization proposal, like its FY 2012 version, is considered “dead on arrival.”

    As one Washington wit put it, “it makes you wonder why the Administration keeps coming up with the same proposals over and over again and expecting different results. Didn’t Einstein say…?

  • China’s Expanding Motorways

    In some ways, it has been an "annus horribilis" for transport in China (Note). There was the tragic high-speed rail accident in Wenzhou (Zhejiang), the fastest trains were slowed, construction was slowed or, in some cases stopped, and a top railway official was removed for misappropriation of at least a billion Yuan (more than $150 million).

    However, China’s freeway (motorway) system has achieved a milestone even Deng Xiaoping might have dreamed. In 2011, The Beijing Review reports that China’s intercity freeway system became the longest in the world, longer that of the United States, which had been the undisputed leader for at least 50 years.

    China added 11,000 kilometers (7,000 miles) of freeway (grade separated and dual carriage expressway) to its national interstate expressway system (National Trunk Highway System) in 2011. With a length of 85,000 kilometers (53,000 miles), China’s intercity freeway system exceeds that of the US interstate highway system by 10,000 kilometers (6,000 miles). At the end of 2008, the US interstate highway system was 75,000 miles long.

    China has built 83,000 kilometers (52,000 miles) of interstate freeway in just 11 years. Much of the US interstate construction was completed over a period of 25 years, from 1956 to the early 1980s.

    It is unclear whether the total length of freeways in China is greater than that in the United States. In China, many urban freeways are not included in the National Trunk Highway System. There are also non-interstate freeways in the United States.  Complete data on these roadways is not available.

    —–

    Note: This characterization of a "horrible year" was made famous by Queen Elizabeth II in a major speech in 1992.

    See also: China Expressway System to Exceed US Interstates, January 21, 2011.

  • The Evolving Urban Form: Moscow’s Auto-Oriented Expansion

    Moscow is bursting at the seams. The core city covers more than 420 square miles (1,090 kilometers), and has a population of approximately 11.5 million people. With 27,300 residents per square mile (10,500 per square kilometer), Moscow is one percent more dense than the city of New York, though Moscow covers 30 percent more land. The 23 ward area of Tokyo (see Note) is at least a third more dense, though Moscow’s land area is at least half again as large as Tokyo.

    All three core areas rely significantly on transit. Muscovites use the Metro at about the same rate as New Yorkers use the subway, taking about 200 trips each year. Tokyo citizens use their two Metro systems at nearly 1.5 times the rate used in Moscow.

    But there are important differences. Moscow officials indicate that approximately two-thirds of Moscow’s employment is in the central area. This is a much higher figure than in the world’s two largest central business districts — Tokyo’s Yamanote Loop and Manhattan — each with quarter or less of their metropolitan employment. Both New York City and Tokyo’s 23 wards have extensive freeway lengths in their cores, which help to make their traffic congestion more tolerable.

    Moscow’s arterial street pattern was clearly designed with the assumption that the dominant travel pattern would be into the core. Major streets either radiate from the core, or form circles or partial circles at varying distances from it. In New York City and Tokyo’s  23 wards there are radial arterials, but,the major streets generally form a grid, which is more conducive to the cross-town traffic and the more random trip patterns that have emerged in the automobile age.

    Moscow has become much, more reliant on cars,  following the examples of metropolitan areas across Europe. The old outer circular road, which encloses nearly all of the central municipality, was long ago upgraded to the MKAD, a 10 lane freeway as long as Washington’s I-495 Capital Beltway (65 miles or 110 kilometers). The MKAD has become a primary commercial corridor, with large shopping centers and three nearby IKEAs.

    It is not surprising, therefore, that traffic congestion and air pollution became serious problems in Moscow. The road system that had been adequate when only the rich had cars was no longer sufficient. The "cookie-cutter" apartment blocks, which had served Iron Curtain poverty, had become obsolete. The continued densification of an already very dense core city led to an inevitable intensification of intensification of traffic congestion and air pollution.

    Transit-oriented Moscow was not working, nor could "walkability" make much difference. In such a large urban area, it is inevitable that average travel distances, especially to work, will be long. Geographically large employment markets are the very foundation of major metropolitan areas. If too many jobs are concentrated in one area, then the traffic becomes unbearable, as many become able to afford cars and use them. Traffic congestion was poised to make Moscow dysfunctional.

    Expanding Moscow

    The leadership of both the Russian Federation and the city of Moscow chose an unusual path, in light of currently fashionable urban planning dogma. Rather than making promises they could not keep about how higher densities or more transit could make the unworkable city more livable, they chose the practical, though in urban planning circles, the "politically incorrect" solution:  deconcentrating the city and its traffic.

    Last year, Russian President Dmitry Medvedev proposed that Moscow be expanded to a land area 2.3 times as large. Local officials and parliament were quickly brought on board. The expanded land area is nearly double that of New York’s suburban Nassau County, and is largely rural (Note 2). Virtually all of the expansion will be south of the MKAD.

    The plan is to create a much larger, automobile-oriented municipality, with large portions of the Russian government to be moved to the expanded area. Employment will be decentralized, given the hardening of the transport arterials that makes the monocentric employment pattern unsustainable. Early plans call for commercial construction more than four times that of Chicago’s loop.

    At the same time, the leadership does not intend to abandon the older, transit-oriented part of the municipality. Mayor Sergei Sobyanin has voiced plans to convert central area government buildings into residences and hotels, adding that there will be the opportunity to build underground parking facilities as refurbishments proceed. Moscow appears to be preparing to offer its citizens both an automobile-oriented lifestyle and a transit-oriented one. The reduced commercial traffic should also make central Moscow a more attractive environment for tourists, who spend too much time traveling between their hotels and historic sites, such as the Kremlin and St. Basil’s.

    Expanding the Family?

    As Moscow expands, the national leadership also wants the Russian family to expand. Russia has been losing population for more than 20 years. Since 1989, the population of the Russian Federation has dropped by 4.5 million residents. When the increase of 3.0 million in the Moscow area is considered, the rest of the nation has lost approximately 7.5 million since 1989. Between the 2002 and the 2010 censuses, Russia lost 2.2 million people and dropped into a population of 142.9 million. Russia’s population losses are pervasive. Out of the 83 federal regions, 66 lost population during the last census.

    Continued population losses could significantly impair national economic growth. The projected smaller number of working age residents will produce less income, while a growing elderly population will need more financial support. This is not just a Russian problem, but Russia is the first of the world’s largest nations to face the issue while undergoing a significant population loss.

    The government is planning strong measures to counter the demographic decline, increase the birth rate, and create a home ownership-based "Russian Dream". Families having three or more children will be granted land for building single-family houses across the nation., including plots of up to nearly one-third of an acre (1,500 square meters).  Many of these houses could be built in Moscow’s new automobile- oriented two-thirds, as well as in the extensive suburbs on the other three sides of the core municipality.

    Expanding Outside the Core

    While population decline is the rule across the Russian Federation, the Moscow urban area has experienced strong growth. Between 2002 and 2010, the Moscow urban area grew from 14.6 million to 16.1 million residents (Note 3). This 1.3 percent annual rate of increase  exceeds the recently the recently announced growth in Canada (1.2 percent). This rate of increase exceeds that of all but 8 of the 51 major metropolitan areas (Note 4) in the United States between 2000 and 2010.

    While the core district grew 6 percent  and added 41,000 residents, growth was strongest outside the core, which accommodated 97 percent of the new residents (See Table). Moscow’s outer districts grew by nearly 1.1 million residents, an 11 percent increase, and its suburbs continued to expand, adding 400,000 residents, an increase of 10  percent. These areas have much lower densities than the city, with many single-family houses.

    Table
    Moscow Urban Area Population
    2002 2010 Change % Change Share of Growth
    Inner Moscow 701,000 743,000 41,000 5.9% 2.7%
    Outer Moscow 9,681,000 10,772,000 1,090,000 11.3% 70.3%
    Suburban 4,198,000 4,617,000 420,000 10.0% 27.0%
    Total 14,581,000 16,132,000 1,551,000 10.6% 100.0%
    Note: Suburban population includes the total population of each district and city that is at least partially in the urban area.


    Moscow, like other international urban areas, is decentralizing, despite considerable barriers. The expansion will lead to even more decentralization, which is likely to lead to less time "stuck in traffic" and more comfortable lifestyles. Let’s hope that Russia’s urban development policies, along with its plans to restore population growth, will lead to higher household incomes and much improved economic performance.

    Wendell Cox is a Visiting Professor, Conservatoire National des Arts et Metiers, Paris and the author of “War on the Dream: How Anti-Sprawl Policy Threatens the Quality of Life

    —–

    Note 1: The 23 ward (ku) area of Tokyo is the geography of the former city of Tokyo, which was abolished in the 1940s. There is considerable confusion about the geography of Tokyo. For example, the 23 ward area is a part of the prefecture of Tokyo, which is also called the Tokyo Metropolis, which has led some analysts to think of it as the Tokyo metropolitan area (labor market area). In fact, the Tokyo metropolitan area, variously defined, includes, at a minimum the prefectures of Tokyo, Kanagawa, Chiba and Saitama with some municipalities in Gunma, Ibaraki and Tochigi. The metropolitan area contains nearly three times the population of the "Tokyo Metropolis."

    Note 2: The expansion area (556 square miles or 1,440 square kilometers) has a current population of 250,000.

    Note 3: Includes all residents in suburban districts with at least part of their population in the urban area.

    Note 4: Urban area data not yet available.

    Photo: St. Basil’s Cathedral (all photos by author)

  • How Lower Income Citizens Commute

    One of the most frequently recurring justifications for densification policies (smart growth, growth management, livability, etc.) lies with the assumption that the automobile-based mobility system (Note 1) disadvantages lower income citizens. Much of the solution, according to advocates of densification is to discourage driving and orient both urbanization and the urban transportation system toward transit as well as walking and cycling.

    Of course, there is no question but that lower income citizens are disadvantaged with respect to just about everything economic. However, there are few ways in which lower income citizens are more disadvantaged than in their practical access to work and to amenities by means of transit, walking and cycling. Indeed, the impression that lower income citizens rely on transit to a significantly greater degree than everyone else is just that – an impression.

    The Data: This is illustrated by a compilation of work trip data from the five-year American Community Survey for 2006 to 2010. In the nation’s 51 major metropolitan areas (more than 1,000,000 population), 76.3% of lower income employees use cars to get to work, three times that of all other modes combined (Figure 1).

    Admittedly, this is less than the 83.3% of all employees who use cars for the work trip, but a lot more than would be expected, especially among those who believe that transit is the principal means of mobility for low income citizens. Overall, 8 times as many lower income citizens commuted by car as by transit. In this analysis, lower income citizens are defined as employees who earn less than $15,000 per year, which is approximately one-half of the median earnings per employee of $29,701. .

    Perhaps most surprising is the fact that only 9.6% of lower income citizens used transit to get to work. This is not very much higher than the 7.9% of all workers in the metropolitan areas who use transit. (Table 1).  

    Table 1
    Work Trip Market Share: 2006-2010
    Lower Income Employees and All Employees
    Metropolitan Areas Over 1,000,000 Population
      Lower Income Employees
    All Employees Market Share Employees Earning Under $15,000 Annually Market Share
    Car, Truck & Van: Alone 56.72 73.4% 9.56 63.1%
    Car, Truck & Van: Carpool 7.67 9.9% 2.00 13.2%
    Car, Truck & Van: Total 64.38 83.3% 11.56 76.3%
    Transit 6.14 7.9% 1.46 9.6%
    Walk 2.19 2.8% 0.89 5.9%
    Other (Taxi, Motorcyle, Bicycle & Other) 1.34 1.7% 0.39 2.6%
    Work At Home 3.24 4.2% 0.85 5.6%
    Total 77.29 100.0% 15.16 100.0%
    In Millions
    Note: Median Earnings: $29,701
    Source: American Community Survey: 2006-2010


    Transit’s small market share has to do with its inherent impracticality as a means of getting to most employment. According to ground-breaking research by the Brookings Institution, low-income citizens could reach only 35 percent of jobs in the major metropolitan areas by transit in 90 minutes. In other words, you cannot get from here to there, at least for most trips. It is no more reasonable for lower income citizens to spend three hours per day commuting than it is for anyone else. A theoretical 90 minute one-way standard is no indicator of usable mobility. It is likely that only about 8 percent of jobs are accessible by lower income citizens in 45 minutes (Note 2) and 4 percent in 30 minutes.

    Automobility: Among the major metropolitan areas, lower income citizens use automobiles to get to work most in Birmingham (90.6%). Fourteen other metropolitan areas have lower income automobile market shares of 85% or more, including Charlotte, Detroit, Dallas-Fort Worth, Indianapolis, Jacksonville, Kansas City, Louisville, Memphis, Nashville, Oklahoma City, Raleigh, San Antonio, St. Louis and Tampa-St. Petersburg. As in all things having to do with urban transportation, there are two Americas: New York and outside New York. By far the lowest automobile market share for low income citizens is in New York, at 49.3%. The second lowest lower income automobile market share is in San Francisco-Oakland, at 63.1%. Washington and Boston are also below 70% (Table 2).

    Table 2
    Work Trip Market Share: Car, Truck or Van: 2006-2010
    Lower Income Employees and All Employees
    Metropolitan Areas Over 1,000,000 Population
      Lower Income Employees
    Metropolitan Area All Employees Employees Earning Under $10,000 Employees Earning $10,000-$14,999 All Under $15,000 (Combined)
    Atlanta, GA 88.3% 82.1% 83.8% 82.8%
    Austin, TX 87.2% 77.8% 82.3% 79.5%
    Baltimore, MD 85.9% 73.8% 77.7% 75.1%
    Birmingham, AL 94.6% 89.3% 92.6% 90.6%
    Boston, MA-NH 77.2% 66.4% 73.4% 68.5%
    Buffalo, NY 89.7% 79.8% 84.3% 81.3%
    Charlotte, NC-SC 90.9% 85.3% 88.5% 86.4%
    Chicago, IL-IN-WI 80.0% 73.0% 77.0% 74.4%
    Cincinnati, OH-KY-IN 91.2% 82.7% 87.9% 84.4%
    Cleveland, OH 87.3% 78.1% 84.3% 80.3%
    Columbus, OH 90.8% 80.3% 87.1% 82.6%
    Denver, CO 85.3% 76.9% 82.1% 78.9%
    Detroit. MI 93.1% 85.8% 89.9% 87.2%
    Dallas-Fort Worth, TX 91.5% 85.4% 88.7% 86.7%
    Hartford, CT 89.7% 76.8% 83.1% 78.8%
    Houston. TX 90.7% 83.6% 86.4% 84.7%
    Indianapolis, IN 92.6% 85.1% 90.2% 86.9%
    Jacksonville, FL 91.6% 85.4% 88.3% 86.5%
    Kansas City,  MO-KS 90.6% 85.2% 87.6% 86.2%
    Los Angeles, CA 84.7% 70.8% 74.1% 72.2%
    Las Vegas, NV 89.7% 80.0% 82.4% 81.0%
    Louisville, KY-IN 92.4% 85.6% 87.6% 86.3%
    Memphis, TN-MS-AR 93.3% 85.0% 89.6% 86.7%
    Miami, FL 88.3% 79.0% 80.9% 79.9%
    Milwaukee, WI 89.3% 78.0% 83.5% 79.8%
    Minneapolis-St. Paul, MN-WI 86.8% 76.9% 81.1% 78.2%
    Nashville, TN 92.0% 86.8% 89.5% 87.8%
    New Orleans, LA 90.0% 80.9% 83.8% 82.0%
    New York, NY-NJ-PA 57.6% 50.0% 48.1% 49.3%
    Oklahoma City, OK 93.1% 86.8% 90.8% 88.2%
    Orlando, FL 89.6% 79.7% 86.1% 81.8%
    Pittsburgh, PA 86.2% 77.9% 81.8% 79.2%
    Philadelphia, PA-NJ-DE-MD 82.1% 70.6% 76.2% 72.4%
    Phoenix, AZ 88.6% 80.5% 83.9% 81.8%
    Portland, OR-WA 81.6% 69.3% 75.1% 71.3%
    Providence, RI-MA 89.9% 79.9% 87.1% 82.3%
    Raleigh, NC 90.8% 84.0% 88.0% 85.4%
    Rochester, NY 89.9% 76.7% 87.0% 80.0%
    Riverside-San Bernardino, CA 90.6% 83.4% 87.1% 84.8%
    Richmond, VA 91.3% 83.2% 86.2% 84.2%
    Sacramento, CA 90.7% 80.8% 86.3% 82.9%
    San Antonio, TX 92.1% 85.7% 88.2% 86.6%
    San Diego, CA 85.9% 73.6% 79.9% 76.0%
    Seattle, WA 81.3% 72.4% 76.1% 73.7%
    San Francisco-Oakland, CA 72.4% 63.3% 63.4% 63.3%
    San Jose, CA 87.1% 74.3% 80.2% 76.4%
    Salt Lake City, UT 88.1% 79.6% 83.4% 81.0%
    St. Louis, MO-IL 91.1% 83.8% 88.6% 85.4%
    Tampa-St. Petersburg, FL 90.1% 84.1% 87.6% 85.5%
    Virginia Beach-Norfolk, VA-NC 89.8% 81.9% 81.8% 81.9%
    Washington, DC-VA-MD-WV 77.1% 67.8% 71.4% 69.0%
    Total: 51 Metropolitan Areas 83.3% 75.1% 78.3% 76.3%
           New York 57.6% 50.0% 48.1% 49.3%
          Outside New York 86.5% 77.8% 81.8% 79.3%
    Average of Metropolitan Areas 87.7% 78.9% 83.0% 80.4%
    Median 89.7% 80.0% 84.3% 81.8%
    Maximum 94.6% 89.3% 92.6% 90.6%
    Minimum 57.6% 50.0% 48.1% 49.3%
    Note: Median Earnings: $29,701
    Source: American Community Survey: 2006-2010


    Transit: It’s not surprising that New York has by far the highest transit market share among lower income commuters. However, New York’s lower income transit market share is only marginally higher than its market share among all commuters, at 31.5%, compared to 30.0% for the entire workforce. San Francisco-Oakland had the second highest lower income transit market share at 16.8%. Boston, Chicago, Philadelphia and Washington were also above 10%. The lowest transit market share among lower income citizens was 1.1% in Oklahoma City. Six other metropolitan areas had lower income transit market shares under 2.5%, including Birmingham, Indianapolis, Jacksonville, Nashville, Raleigh and San Antonio (Table 3).

    Table 3
    Work Trip Market Share: Transit: 2006-2010
    Lower Income Employees and All Employees
    Metropolitan Areas Over 1,000,000 Population
      Lower Income Employees
    Metropolitan Area All Employees Employees Earning Under $10,000 Employees Earning $10,000-$14,999 All Under $15,000 (Combined)
    Atlanta, GA 3.4% 5.6% 6.2% 5.8%
    Austin, TX 2.6% 5.9% 5.3% 5.6%
    Baltimore, MD 6.3% 9.8% 9.3% 9.6%
    Birmingham, AL 0.7% 1.8% 1.8% 1.8%
    Boston, MA-NH 11.9% 12.3% 13.3% 12.6%
    Buffalo, NY 3.7% 6.9% 5.8% 6.6%
    Charlotte, NC-SC 2.0% 3.5% 3.1% 3.3%
    Chicago, IL-IN-WI 11.4% 11.9% 12.5% 12.1%
    Cincinnati, OH-KY-IN 2.4% 4.3% 3.8% 4.1%
    Cleveland, OH 2.7% 5.3% 3.1% 4.5%
    Columbus, OH 1.7% 3.5% 3.8% 3.6%
    Denver, CO 4.6% 7.2% 7.2% 7.2%
    Detroit. MI 1.5% 3.5% 3.1% 3.3%
    Dallas-Fort Worth, TX 1.6% 2.6% 2.9% 2.7%
    Hartford, CT 2.8% 5.4% 5.0% 5.3%
    Houston. TX 2.6% 4.1% 4.3% 4.1%
    Indianapolis, IN 1.0% 2.6% 1.6% 2.2%
    Jacksonville, FL 1.1% 2.5% 2.4% 2.5%
    Kansas City,  MO-KS 1.7% 3.8% 3.4% 3.6%
    Los Angeles, CA 6.1% 11.7% 13.9% 12.6%
    Las Vegas, NV 3.6% 7.4% 7.6% 7.5%
    Louisville, KY-IN 2.2% 4.7% 3.7% 4.3%
    Memphis, TN-MS-AR 1.3% 3.3% 3.1% 3.3%
    Miami, FL 3.7% 7.9% 8.3% 8.1%
    Milwaukee, WI 3.7% 7.7% 7.4% 7.6%
    Minneapolis-St. Paul, MN-WI 4.6% 6.4% 6.4% 6.4%
    Nashville, TN 1.0% 1.8% 2.0% 1.9%
    New Orleans, LA 2.5% 5.0% 5.3% 5.1%
    New York, NY-NJ-PA 30.5% 30.0% 34.0% 31.5%
    Oklahoma City, OK 0.5% 1.3% 0.8% 1.1%
    Orlando, FL 3.9% 7.4% 5.9% 6.9%
    Pittsburgh, PA 5.8% 6.2% 6.4% 6.3%
    Philadelphia, PA-NJ-DE-MD 9.3% 12.2% 11.8% 12.1%
    Phoenix, AZ 2.2% 4.2% 4.9% 4.5%
    Portland, OR-WA 6.2% 9.3% 8.3% 8.9%
    Providence, RI-MA 2.6% 3.3% 3.2% 3.3%
    Raleigh, NC 0.9% 1.9% 2.1% 2.0%
    Rochester, NY 2.0% 4.8% 3.0% 4.2%
    Riverside-San Bernardino, CA 1.6% 2.7% 2.3% 2.6%
    Richmond, VA 1.9% 3.8% 4.4% 4.0%
    Sacramento, CA 2.2% 5.1% 4.6% 4.9%
    San Antonio, TX 1.3% 2.3% 2.8% 2.5%
    San Diego, CA 3.3% 6.9% 6.1% 6.6%
    Seattle, WA 8.2% 9.9% 10.5% 10.1%
    San Francisco-Oakland, CA 14.6% 15.8% 18.4% 16.8%
    San Jose, CA 3.3% 6.1% 6.0% 6.1%
    Salt Lake City, UT 3.2% 5.2% 4.5% 5.0%
    St. Louis, MO-IL 2.6% 4.8% 3.4% 4.4%
    Tampa-St. Petersburg, FL 1.4% 2.9% 2.3% 2.7%
    Virginia Beach-Norfolk, VA-NC 1.7% 3.8% 4.7% 4.1%
    Washington, DC-VA-MD-WV 13.9% 14.3% 15.8% 14.8%
    Total: 51 Metropolitan Areas 7.9% 9.4% 10.1% 9.7%
           New York 30.5% 30.0% 34.0% 31.5%
          Outside New York 5.1% 7.1% 7.4% 7.2%
    Average of Metropolitan Areas 4.3% 6.3% 6.3% 6.3%
    Median 2.6% 5.1% 4.7% 4.9%
    Maximum 30.5% 30.0% 34.0% 31.5%
    Minimum 0.5% 1.3% 0.8% 1.1%
    Note: Median Earnings: $29,701
    Source: American Community Survey: 2006-2010


    Automobile and Transit Metrics: The difference in automobile commuting between all employees and lower income employees turns out to be surprisingly small. The least variation is in Birmingham, where the automobile market share among lower income commuters is 4.3% below that of all commuters. Charlotte, Kansas City and Nashville also have lower income market share variations of less than 5%. The greatest variation is in Los Angeles, where the automobile market share among lower income commuters is 14.7% less than for all commuters. The lower income automobile market share is also at least 12.5% below that of all commuters in Baltimore, New York and Portland.

    Oklahoma City has the most lower income automobile commuters in relation to transit commuters, with 81.3 times as many lower income commuters using automobiles as opposed to transit. In Birmingham, Nashville and Raleigh, there are more than 40 lower income automobile commuters per transit commuter.  In contrast, the number of low-income automobile commuters in New York is 1.6 times that of lower income transit commuters. Again, New York is in a class by itself (Figure 2). Outside New York, there are 11.0 times as many lower income automobile commuters as transit commuters. San Francisco-Oakland (3.8) and Washington (4.7) are the only other metropolitan areas with fewer than five lower income automobile commuters per transit commuter (Table 4).

    Table 4
    Work Trip Market Share: 2006-2010
    Lower Income Employees and All Employees
    Metrics: Car, Truck or Van & Transit
    Metropolitan Areas Over 1,000,000 Population
    Lower Income Car, Truck or Van Market Share Compared to All Car Truck or Van Market Share Times Transit
    Metropolitan Area Employees Earning Under $10,000 Employees Earning $10,000-$14,999 All Under $15,000 (Combined)
    Atlanta, GA -7.0% -5.0% -6.3% 14.2
    Austin, TX -10.8% -5.5% -8.8% 14.1
    Baltimore, MD -14.1% -9.6% -12.6% 7.8
    Birmingham, AL -5.6% -2.1% -4.3% 50.7
    Boston, MA-NH -14.1% -5.0% -11.2% 5.4
    Buffalo, NY -11.1% -6.0% -9.4% 12.4
    Charlotte, NC-SC -6.1% -2.6% -4.9% 25.9
    Chicago, IL-IN-WI -8.8% -3.8% -7.0% 6.1
    Cincinnati, OH-KY-IN -9.3% -3.6% -7.4% 20.4
    Cleveland, OH -10.5% -3.3% -8.0% 17.7
    Columbus, OH -11.5% -4.0% -9.0% 23.1
    Denver, CO -9.8% -3.8% -7.5% 10.9
    Detroit. MI -7.8% -3.5% -6.4% 26.2
    Dallas-Fort Worth, TX -6.7% -3.0% -5.2% 31.7
    Hartford, CT -14.4% -7.4% -12.2% 15.0
    Houston. TX -7.9% -4.8% -6.6% 20.5
    Indianapolis, IN -8.1% -2.5% -6.2% 39.1
    Jacksonville, FL -6.8% -3.6% -5.6% 35.1
    Kansas City,  MO-KS -5.9% -3.4% -4.9% 23.7
    Los Angeles, CA -16.4% -12.4% -14.7% 5.7
    Las Vegas, NV -10.8% -8.1% -9.8% 10.8
    Louisville, KY-IN -7.4% -5.3% -6.6% 19.9
    Memphis, TN-MS-AR -9.0% -4.0% -7.1% 26.7
    Miami, FL -10.5% -8.4% -9.6% 9.9
    Milwaukee, WI -12.6% -6.5% -10.6% 10.5
    Minneapolis-St. Paul, MN-WI -11.4% -6.5% -9.8% 12.2
    Nashville, TN -5.7% -2.7% -4.6% 46.1
    New Orleans, LA -10.2% -6.9% -8.9% 15.9
    New York, NY-NJ-PA -13.1% -16.5% -14.4% 1.6
    Oklahoma City, OK -6.8% -2.5% -5.3% 81.3
    Orlando, FL -11.1% -3.9% -8.7% 11.8
    Pittsburgh, PA -9.7% -5.2% -8.2% 12.7
    Philadelphia, PA-NJ-DE-MD -14.0% -7.2% -11.8% 6.0
    Phoenix, AZ -9.1% -5.3% -7.6% 18.1
    Portland, OR-WA -15.1% -7.9% -12.5% 8.0
    Providence, RI-MA -11.1% -3.1% -8.4% 25.3
    Raleigh, NC -7.4% -3.1% -5.9% 42.8
    Rochester, NY -14.7% -3.3% -11.0% 19.1
    Riverside-San Bernardino, CA -8.0% -3.9% -6.5% 32.7
    Richmond, VA -8.9% -5.6% -7.7% 20.9
    Sacramento, CA -10.9% -4.8% -8.6% 17.0
    San Antonio, TX -7.0% -4.2% -6.1% 35.1
    San Diego, CA -14.3% -7.0% -11.5% 11.5
    Seattle, WA -10.9% -6.4% -9.3% 7.3
    San Francisco-Oakland, CA -12.5% -12.4% -12.5% 3.8
    San Jose, CA -14.7% -8.0% -12.3% 12.6
    Salt Lake City, UT -9.6% -5.3% -8.1% 16.3
    St. Louis, MO-IL -8.0% -2.8% -6.3% 19.6
    Tampa-St. Petersburg, FL -6.6% -2.7% -5.1% 31.8
    Virginia Beach-Norfolk, VA-NC -8.7% -8.9% -8.8% 19.8
    Washington, DC-VA-MD-WV -12.0% -7.3% -10.4% 4.7
    Total: 51 Metropolitan Areas -9.8% -6.0% -8.4% 7.9
           New York -13.1% -16.5% -14.4%                   1.6
          Outside New York -10.1% -5.5% -8.4% 11.0
    Average of Metropolitan Areas -10.1% -5.5% -8.5% 12.7
    Median -9.8% -5.0% -8.2%                17.0
    Maximum -5.6% -2.1% -4.3%                81.3
    Minimum -16.4% -16.5% -14.7%                   1.6
    Note: Median Earnings: $29,701
    Source: American Community Survey: 2006-2010


    A Line Driven in a Car: Why is this the case?  The "bottom line" has been perhaps best characterized by Marge Waller and Mark Allen Hughes in a research paper for the Progressive Policy Institute of the Democratic Leadership Council.

    In most cases, the shortest distance between a poor person and a job is along a line driven in a car. Prosperity in America has always been strongly related to mobility and poor people work hard for access to opportunities. For both the rural and inner-city poor, access means being able to reach the prosperous suburbs of our booming metropolitan economies, and mobility means having the private automobile necessary for the trip. The most important response to the policy challenge of job access for those leaving welfare is the continued and expanded use of cars by low-income workers

    Concerns about the automobile based urban transportation system excluding lower income citizens are misplaced. Despite all the hand-wringing, America’s lower income population has considerable access to cars and far greater mobility as a result. It is no more than a figment of planner’s imaginations that lower income citizens would be best served by constraining car use and trying to force them into transit service that more often than not gives circuitous, slower and often impossible for access to work opportunities.

    Wendell Cox is a Visiting Professor, Conservatoire National des Arts et Metiers, Paris and the author of “War on the Dream: How Anti-Sprawl Policy Threatens the Quality of Life

    —–

    Note 1: As used in this article, automobile includes cars, trucks and vans.

    Note 2: This estimate estimates lower income 45 minute access using the ration between 90 minute and 45 minute for all employees (as reported in the Brookings Institution report)

    Photograph: Classic early 1950s Buick, Sinsheim Auto & Technik Museum, Sinsheim, Baden-Württemberg, Germany (by author).

  • Why Pleas to Increase Infrastructure Funding Fall on Deaf Ears

    Letting the nation’s roads and bridges deteriorate may worsen traffic congestion and add to our commuting woes, but when water and sewer systems begin to fail our very civilization is at risk. That is the message of a recent story in The Washington Post drawing attention to the alarming state of the nation’s water and sewer infrastructure. The story looks at the Washington D.C. system as a poster child for neglected and dilapidated municipal utilities. The average age of the District water pipes is 77 years and a great many were laid in the 19th century, notes the Post article. Emergency crews rush from site to site to tackle an average of 450 breaks a year. ("Billions needed to upgrade America’s leaky water infrastructure," by Alfred Halsey III, January 2, 2012).

    Antiquated municipal water and sewer systems are indeed a ticking bomb— all the more so since their deterioration, unlike that of highways and bridges— remains invisible until a break occurs. But maintaining water and sewer infrastructure in a state of good repair is a fairly straightforward challenge. Water supply and sewers are a public utility and as such they can cover their maintenance and replacement costs through user fees. So can many other public services such as electricity, natural gas, broadband and telecommunications. The ability to charge for service (and to raise rates as necessary) assures public utilities a steady and reliable stream of revenue with which to maintain, preserve and grow their assets.

    Finding the resources to keep transportation infrastructure in good order is a more difficult challenge. Unlike traditional utilities, roads and bridges have no rate payers to fall back on. Politicians and the public seem to attach a low priority to fixing aging transportation infrastructure and this translates into a lack of support for raising fuel taxes or imposing tolls.

    Investment in infrastructure did not even make the top ten list of public priorities in the latest Pew Research Center survey of domestic concerns. Calls by two congressionally mandated commissions to vastly increase transportation infrastructure spending have gone ignored. So have repeated pleas by advocacy groups such as Building America’s Future, the U.S. Chamber of Commerce and the University of Virginia’s Miller Center.

    Nor has the need to increase federal spending on infrastructure come up in the numerous policy debates held by the Republican presidential candidates. Even President Obama seems to have lost his former fervor for this issue. In his last State-of-the-Union message he made only a perfunctory reference to "rebuilding roads and bridges." High-speed rail and an infrastructure bank, two of the President’s past favorites, were not even mentioned.

    Why pleas to increase infrastructure funding fall on deaf ears

    There are various theories why appeals to increase infrastructure spending do not resonate with the public. One widely held view is that people simply do not trust the federal government to spend their tax dollars wisely. As proof, evidence is cited that a great majority of state and local transportation ballot measures do get passed, because voters know precisely where their tax money is going. No doubt there is much truth to that. Indeed, thanks to local funding initiatives and the use of tolling, state transportation agencies are becoming increasingly more self-reliant and less dependent on federal funding

    Another explanation, and one that I find highly plausible, has been offered by Charles Lane, editorial writer for the Washington Post. Wrote Lane in an October 31, 2011 Washington Post column, "How come my family and I traveled thousands of miles on both the east and west coast last summer without actually seeing any crumbling roads or airports? On the whole, the highways and byways were clean, safe and did not remind me of the Third World countries. … Should I believe the pundits or my own eyes?" asked Lane ("The U.S. infrastructure argument that crumbles upon examination").

    Along with Lane, I think the American public is skeptical about alarmist claims of "crumbling infrastructure" because they see no evidence of it around them. State DOTs and transit authorities take great pride in maintaining their systems in good condition and, by and large, they succeed in doing a good job of it. Potholes are rare, transit buses and trains seldom break down, and collapsing bridges, happily, are few and far between.

    The oft-cited "D" that the American Society of Civil Engineers has given America’s infrastructure (along with an estimate of $2.2 trillion needed to fix it) is taken with a grain of salt, says Lane, since the engineers’ lobby has a vested interest in increasing infrastructure spending, which means more work for engineers.  Suffering from the same credibility problem are the legions of road and transit builders, rail and road equipment manufacturers, construction firms, planners and consultants that try to make a case for more money.

    This does not mean that the country does not need to invest more resources in preserving and expanding its highways and transit systems. The "infrastructure deficit" is real. It’s just that in making a case for higher spending, the transportation community must do a much better job of explaining why, how and where they propose to spend those funds. Usupported claims that the nation’s infrastructure is "falling apart" will not be taken seriously.

    People want to know where their tax dollars are going and what exactly they’re getting for their money. Infrastructure advocates must learn from state and local ballot measures to justify and document the needs for federal dollars with more precision so that the public regains confidence that their money will be spent wisely and well.

  • The Moonbeam Express

    Seldom has public opinion and expert judgment been more unified than in its opposition to  the California high-speed rail project.    The project has been criticized by its own Peer Review Group, the Legislative Analyst’s Office (LAO), the California State Auditor,  the State Treasurer and a group of independent  experts  (Enthoven, Grindley, Warren et al.).  In addition, the bullet train has come under severe criticism by influential state legislators and  by members of the state’s congressional delegation. Equally damaging to the project’s future prospects have been two public opinion surveys showing  that California voters have turned solidly against the project, and the opposition of  virtually all of California’s newspapers, including The Orange County Register, whose latest editorial we reprint below.  

    Editorial: Bullet train becoming "Moonbeam Express" (OC Register, Feb 1, 2012)
    Gov. Jerry Brown wants to use anti-global-warming carbon taxes to fund California’s much-maligned high-speed rail project. 

    In a brazen denial of the obvious, Gov. Jerry Brown now insists the proposed California high-speed rail can be built for much less than its own business plan stipulates, and wants to use anti-global-warming carbon taxes to underwrite the proposal, whose price tag has nearly tripled in the three years since voters approved it.

    The governor seems intent on demonstrating how California’s state government has burdened taxpayers with mounting debt, while overspending to create consecutive years of budget deficits. The rail project has been dubbed "the train to nowhere" because the only portion close to being built would link relatively sparsely populated Central Valley towns and no metropolitan areas. Perhaps with Mr. Brown’s new foolish insistence, it should be christened the Moonbeam Express. 

    Since the rail proposal appeared on the 2008 ballot, it has been widely and legitimately criticized in detailed analyses by the rail project’s own Peer Review Group, the state auditor, treasurer, Legislative Analyst’s Office, local governments including Tulare, Madera and Kings counties and the city of Palo Alto, numerous state and federal lawmakers from both parties and studies by UC Berkeley Institute of Transportation and the Reason Foundation. These highly unfavorable critiques reflect many of the criticisms the Register Editorial Board has raised since the project was proposed.

    In only three years, the train’s estimated cost has increased from $33 billion to $98.5 billion in the latest version of its own ever-changing business plan.

    Voters approved only $9.9 billion in bonds based on the rest coming from Washington and local governments along the route, and private investors. Washington has provided about $3 billion and not another dime has materialized or been pledged. Meanwhile, the estimated completion of the original phase of the project, from San Francisco to Anaheim, has been extended 14 years beyond the original estimate of 2020.

    Ridership estimates are unrealistic, meaning trains can’t operate solely on ticket revenue as required by the initiative. Costs, even at their current highest level, are certain to increase, and the needed additional funding sources are not forthcoming. Given hostility in Congress to the project, more money from Washington, which is grappling with its own massive deficits and debts, won’t be seen in the foreseeable future.

    State Sen. Doug LaMalfa, R-Richvale, introduced a bill Monday to put the high-speed rail proposal back on the November ballot so voters can de-authorize selling the $9.9 billion in bonds.

    The Register has urged this ill-conceived and increasingly untenable project be resubmitted to voters. Thankfully, for the most part, bonds remain unsold. There is no reason taxpayers should assume billions more debt — with annual interest payments of up to $1 billion — when the likelihood is remote the train ever will be built, despite the governor’s strained assurance.

    Moreover, state Sen. Diane Harkey, R-Dana Point, notes that the governor’s proposed new revenue stream — carbon taxes created by the 2006 Global Warming Solutions Act— is another hoped-for, rather than assured, solution. "The state’s cap-and-trade program is not yet in operation, and revenue estimates of $1 billion per year are unreliable and unsubstantiated," Ms. Harkey said. "Relying on projected revenues that fall short is the key reason why our state deficit continues to explode year after year. To rush this project forward, just using up the $3.5 billion of federal funds, with the hope of an additional funding mechanism based on guesswork, is irresponsible."

  • The Evolving Urban Form: Guangzhou-Foshan

    The Pearl River Delta of China is home to the largest extent of continuous urbanization in the world. The Pearl River Delta has 55 million people in the jurisdictions of Hong Kong, Shenzhen, Dongguan, Guangzhou, Foshan, Zhongshan, Jiangmen, Zhuhai and Macau. Moreover, the urban population is confined to barely 10 percent of the land area. These urban areas are the largest export engine of China and reflect the successful legacy of Deng Xiaoping’s reforms which had their start with the special economic zone in Shenzhen and spread to the rest of the Delta and then much of the nation.

    Adjacent Metropolitan Areas: However, the Pearl River Delta today is not a metropolitan area, as is often asserted. Instead it is rather a collection of adjacent metropolitan areas or labor markets (Figure 1). Metropolitan areas are not created by a large number of people living close to one another. Metropolitan areas are labor markets, crudely delineating the geography of the jobs-housing balance. There is little commuting between the Pearl River jurisdictions. Moreover, as labor markets, metropolitan areas cannot be international unless there is virtual free movement of labor (Note). In the case of Hong Kong and Macau, commuting between the neighboring jurisdictions of Shenzhen and Zhuhai requires crossing the equivalent of an international border.


    Integrating Guangzhou and Foshan: Transportation integration has already come to two of the jurisdictions, Guangzhou and Foshan. The adjacent prefectures (confusingly interpreted into English as "cities") are now linked by a subway and unlike the other Pearl River Delta jurisdictions, the continuous urbanization does not narrow at the border (Figure 1). There are even proposals to merge the adjacent prefectures.

    Guangzhou and Foshan are separated by a tributary of the Pearl River, with a number of bridges that provide similar crossing capacity as exists in cross-river metropolitan areas like Portland (Willamette River), Cincinnati (Ohio River) and St. Louis (Mississippi River).

    Guangzhou itself is the capital of Guangdong, the largest province of China, with approximately 105 million people. Guangdong is the third largest state or province (sub-national jurisdiction) in the world, trailing the states of Uttar Pradesh (contains the eastern suburbs of Delhi) and Maharashtra (capital Mumbai) in India.

    Guangzhou is larger than Foshan. It is better known to many Westerners as Canton, and for many years served as China’s “window” on the west. Even in China, the alternative name is still used, for example in the annual Canton Fair, one of the largest trade fairs in the world.

    Canton was also a principal flashpoint of 19th century hostilities between the British and Chinese. The First Opium War (1839-42) began at Canton and led to the cession of Hong Kong to Great Britain and the establishment of British treaty ports at Fuzhou, Xiamen, Ningbo, Shanghai and Canton (Guangzhou). After the Second Opium War (1856-60), other treat ports were established and France, the United States, Russia, Germany, Japan and others gained similar rights to the British from a weakened Chinese government.

    In 2010, the metropolitan area county and district level jurisdictions of Guangzhou-Foshan had 18.3 million people. This is an increase of 4.4 million from 2000 and 11.6 million from 1982. This is surely a rapid rate of growth, but Shanghai and Beijing grew even faster over the last decade, each adding more than 6 million people.

    Distribution of Population Growth: In contrast to Shanghai and Beijing, where virtually all of the growth has been outside the core, the Guangzhou-Foshan core is growing robustly. From 2000 to 2010, the core districts increased from a population of 4,040,000 to 5,050,000. With a land area of 107 square miles (279 square kilometers), the core is similar in size to the city (municipality) of Sacramento, which has less than one-tenth the population. The core density is 46,800 per square mile (18,100 per square kilometer), up from 37,500 per square mile (14,500 per square kilometer) in 2000. This is about one-third less dense than Manhattan or the ville de Paris (the central city).

    However, as is typical for metropolitan areas around the world, Guangzhou-Foshan’s growth has been most concentrated in suburban areas. The core accounted for 23% of the population growth over the past decade, while the suburbs accounted for 77%.

    The inner suburbs grew from a population of 6,670,000 to 8,400,000. The density rose from 5,000 to 6,300 per square mile (1,900 to 2,500 per square kilometer), similar to that of the San Francisco urban area. The inner suburbs accounted for 39% of the growth and grew 26%.

    The outer suburbs grew from a population of 3,150,000 to 8,200,000 over the past decade. The population density rose from 2,000 to 3,100 per square mile (800 to 1,200 per square kilometer), slightly more dense than the Philadelphia urban area and slightly less dense than the Portland urban area. The outer suburbs accounted for 38% of the growth and grew at the greatest rate, 53% (Figures 2 & 3, Table).


    Guangzhou-Foshan Metropolitan Area & Urban Area
    2000 & 2010 Census
    Metropolitan Area Core Inner Suburbs Outer Suburbs Total
    2000         4,040,000        6,670,000            3,150,000         13,860,000
    2010         5,050,000        8,400,000            4,820,000         18,270,000
    Change         1,010,000        1,730,000            1,670,000           4,410,000
    % 25% 26% 53% 32%
    Share of Growth 23% 39% 38% 100%
    Area (KM2)                   279               3,429                   4,003                  7,711
    Area (Square Miles)                   108               1,324                   1,546                  2,977
    Density (KM2)              18,100               2,400                   1,200                  2,400
    Density (Square Miles)              46,800               6,300                   3,100                  6,100
    Urban Area  Core   Suburbs   Total 
    2010         5,050,000          11,225,000         16,275,000
    Area (KM2)                   279                   2,894                  3,173
    Area (Square Miles)                   108                   1,117                  1,225
    Density (KM2)              18,100                   3,900                  5,100
    Density (Square Miles)              46,800                 10,000                13,300
    Notes
    Boundary changes render district area data incomplete.
    Core: Yuexiu, Liwan, Haizhu, Tianhe 
    Inner Suburbs: Baiyun, Huangpu, Panyu, Nansha, Nanhai, Changcheng
    Outer Suburbs: Huadu, Luogang, Gaoming, Shunde, Shanshi 
    Nansha is in the inner suburbs because 2000 data is combined with Panyu (should be in the outer suburbs)

    Earlier data shows this suburban pattern has been a long term trend.  Between 1982 and 2010, the suburbs accounted for 57% of the growth outside the city of Guangzhou as then defined (Figure 4). District boundary changes limit a more precise analysis based upon a core that did not include large areas without development.

    The Guangzhou-Foshan Urban Area: The soon to be released 8th Annual Demographia World Urban Areas will show the Guangzhou urban area (area of continuous development within the metropolitan area) to have a population of approximately 16.275 million, with a land area of approximately 1,225 square miles (3,173 square kilometers). Barring later data from the multiple national censuses that will soon be reporting data, Guangzhou-Foshan is likely to be ranked the 14th largest urban area in the world. The population density is approximately 13,300 per square mile (5,100 per square kilometer), roughly comparable to the London or Barcelona urban areas. The suburbs of the urban area have a density of approximately 10,000 per square mile (3,900 per square kilometer). Most of the new residential development is multi-unit, such as high rise condominium buildings and work related housing, including dormitories. However, there is some detached housing, which is very expensive.

    A Larger Metropolitan Area: In the longer run a much larger metropolitan (and urban) area could result, if Chinese residents begin traveling to work over much longer distances between these jurisdictions and should the border restrictions at Hong Kong and Macau be eliminated. To achieve this end, there will need to be important local transportation improvements between the jurisdictions, such as more urban railways (which are planned) and wider automobile ownership, to use the already comprehensive (toll) freeway system.

    Wendell Cox is a Visiting Professor, Conservatoire National des Arts et Metiers, Paris and the author of “War on the Dream: How Anti-Sprawl Policy Threatens the Quality of Life

    ——

    Note: International metropolitan areas can now exist in the European Union, where there is free movement of labor across national borders. For example, the Lille metropolitan area is located in both France and Belgium. France and Switzerland (not a member of the European Union) provide another example, where treaty provisions permit international movement of labor with little difficulty in the resulting international metropolitan areas of Geneva (Switzerland-France) and Basel (Switzerland-France).

    Photo (top): Pagoda: Temple of the Six Banyan Trees, Guangzhou (all photos by author)

  • “Jaw-Droppingly Shameless:” Mother Jones on California High Speed Rail Projection

    Kevin Drum of Mother Jones reports on the highly questionable "cost of alternatives" that has been routinely repeated by proponents of the California high speed rail project, in an article entitled "California High Speed Rail Even More Ridiculous than Before."

    The mantra goes something like, "yes high speed rail is expensive, but it would cost even more to not build it." Yes, indeed, it is expensive, starting at the low estimate of $98.5 billion the press and proponents usually cite to the nearly $118 billion that the California High Speed Rail Authority itself indicates. Advocates then cite a $171 billion figure as what Californian’s would have to pay if they didn’t build the line.

    Joseph Vranich and I detailed the flaws in this "alternatives estimate" in a Wall Street Journal commentary on January 10 ("California’s High Speed Rail Fibs"). We noted that the claim "sets a new low for planning projections in a field that has been rife with abuse." This was a reference to "strategic misrepresentation” ("lying") that has characterized rail project forecasts, according to top European academics.

    Drum goes further, calling the claim "jaw-droppingly shameless," an appropriate characterization based upon the method and documentation. He goes on to suggest that "A high school sophomore who turned in work like this would get an F."

    Regardless of the views that officials or the public may have on high speed rail, they are entitled to a standard of professional (and taxpayer financed) analysis above "jaw-droppingly shameless."