Tag: Transportation

  • Decade of the Telecommute

    The rise in telecommuting is the unmistakable message of the just released 2009 American Community Survey data. The technical term is working at home, however the strong growth in this market is likely driven by telecommuting, as people use information technology and communications technology to perform jobs that used to require being in the office.

    In 2009, 1.7 million more employees worked at home than in 2000. This represents a 31% increases in market share, from 3.3 percent to 4.3 percent of all employment. Transit also rose, from 4.6% to 5.0%, an increase of 9% (Note). Even so, single occupant automobile commuting also rose, from 75.7% to 76.1%, despite the huge increase in gasoline prices. The one means of transport that continued to decline was car pooling, which saw its share decline from 12.1% in 2000 to 10.0% in 2009.

    The increase in working at home was pervasive in scope. The share of employees working at home rose in every major metropolitan area (over 1,000,000 population), with an average increase of 38%. The largest increase was in Charlotte – ironically a metropolitan area with large scale office development in its urban core – with an 88% increase in the work at home market share. In five metropolitan areas, the increase was between 70% and 80% (Richmond, Tampa-St. Petersburg, Raleigh, Jacksonville and Orlando). Only five metropolitan areas experienced market share increases less than 20% (New Orleans, Salt Lake City, Rochester, Buffalo and Oklahoma City). Nonetheless, the rate of increase in the work at home market share exceeded that of transit in 49 of the 52 major metropolitan areas. Transit’s increase was greater only in Washington, Seattle and Nashville (where the transit market share is miniscule).

    The working at home market share increase was also strong outside the major metropolitan areas, rising 23%.

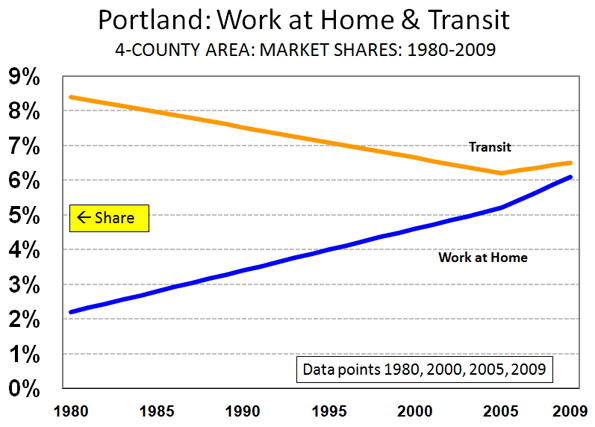
    Working at home is fast closing the gap with transit. In part driven by the surge in energy prices since earlier in the decade, transit experienced its first increase since data was first collected by the Bureau of the Census in 1960. Yet working at home is growing more rapidly, and closing the gap, from 1.7 million fewer workers than transit in 2000 to only 1.0 million fewer in 2009. At the current rate, more people could be working at home than riding transit by 2017. This is already the case in much of the country outside the New York metropolitan area, which represents a remarkable 39 percent of the nation’s transit commuters. Taking New York out of the picture, 31% more people (1.35 million) worked at home than traveled by transit, more than 4 times the 7% difference in 2000 (Table 1, click for additional information).

    Table 1
    Transit & Work at Home Share of Commuting
    Major Metropolitan Areas: 2000 & 2009
      Transit Work at Home
    Metropolitan Area 2000 2009 2000-2009 2000 2009 2000-2009
    New York 27.4% 30.5% 11.4% 2.9% 3.9% 32.6%
    Los Angeles 5.6% 6.2% 11.6% 3.5% 4.8% 35.3%
    Chicago 11.3% 11.5% 2.0% 2.9% 4.0% 37.1%
    Dallas-Fort Worth 1.8% 1.5% -13.3% 3.0% 4.1% 37.0%
    Philadelphia 8.9% 9.3% 3.7% 2.9% 3.9% 35.0%
    Houston 3.2% 2.2% -29.2% 2.5% 3.4% 37.4%
    Miami-West Palm Beach 3.2% 3.5% 9.7% 3.1% 4.5% 48.0%
    Atlanta 3.4% 3.7% 8.7% 3.5% 5.6% 59.9%
    Washington 11.2% 14.1% 26.6% 3.7% 4.5% 22.7%
    Boston 11.2% 12.2% 9.8% 3.3% 4.3% 31.9%
    Detroit 1.7% 1.6% -4.7% 2.2% 3.1% 40.1%
    Phoenix 1.9% 2.3% 17.5% 3.7% 5.3% 44.3%
    San Francisco-Oakland 13.8% 14.6% 6.0% 4.3% 6.0% 40.5%
    Riverside 1.6% 1.8% 9.0% 3.5% 4.6% 32.6%
    Seattle 7.0% 8.7% 25.0% 4.2% 5.1% 23.6%
    Minneapolis-St. Paul 4.4% 4.7% 6.4% 3.8% 4.6% 20.6%
    San Diego 3.3% 3.1% -7.0% 4.4% 6.6% 50.2%
    St. Louis 2.2% 2.5% 14.2% 2.9% 3.5% 22.5%
    Tampa-St. Petersburg 1.3% 1.4% 11.0% 3.1% 5.5% 75.7%
    Baltimore 5.9% 6.2% 5.8% 3.2% 3.9% 23.2%
    Denver 4.4% 4.6% 4.3% 4.6% 6.2% 36.4%
    Pittsburgh 5.9% 5.8% -2.9% 2.5% 3.2% 28.5%
    Portland 6.3% 6.1% -3.0% 4.6% 6.1% 32.9%
    Cincinnati 2.8% 2.4% -13.4% 2.7% 3.8% 40.3%
    Sacramento 2.7% 2.7% 0.8% 4.0% 5.4% 33.1%
    Cleveland 4.1% 3.8% -8.1% 2.7% 3.4% 25.0%
    Orlando 1.6% 1.8% 15.4% 2.9% 4.9% 71.4%
    San Antonio 2.7% 2.3% -12.5% 2.6% 3.4% 29.0%
    Kansas City 1.2% 1.2% 4.6% 3.5% 4.3% 24.7%
    Las Vegas 4.4% 3.2% -26.8% 2.3% 3.3% 45.1%
    San Jose 3.4% 3.1% -9.6% 3.1% 4.5% 44.4%
    Columbus 2.1% 1.4% -35.0% 3.0% 4.1% 36.7%
    Charlotte 1.4% 1.9% 32.2% 2.9% 5.4% 88.1%
    Indianapolis 1.3% 1.0% -22.2% 3.0% 3.7% 24.7%
    Austin 2.5% 2.8% 11.7% 3.6% 5.9% 64.6%
    Norfolk 1.7% 1.4% -17.7% 2.7% 3.4% 27.9%
    Providence 2.4% 2.7% 12.8% 2.2% 3.6% 64.5%
    Nashville 0.8% 1.2% 38.5% 3.2% 4.3% 34.6%
    Milwaukee 4.2% 3.7% -12.5% 2.6% 3.2% 25.3%
    Jacksonville 1.3% 1.2% -9.1% 2.3% 4.0% 73.8%
    Memphis 1.6% 1.5% -8.1% 2.2% 3.1% 41.3%
    Louisville 2.0% 2.4% 20.2% 2.5% 3.1% 22.9%
    Richmond 1.9% 2.0% 6.5% 2.7% 4.7% 76.8%
    Oklahoma City 0.5% 0.4% -13.0% 2.9% 3.1% 4.7%
    Hartford 2.8% 2.8% -1.3% 2.6% 4.0% 53.6%
    New Orleans 5.4% 2.7% -50.3% 2.4% 2.9% 19.2%
    Birmingham 0.7% 0.7% -2.3% 2.1% 2.7% 29.5%
    Salt Lake City 3.3% 3.0% -10.1% 4.0% 4.7% 17.8%
    Raleigh 0.9% 1.0% 10.7% 3.5% 6.0% 74.4%
    Buffalo 3.3% 3.6% 7.9% 2.1% 2.3% 8.3%
    Rochester 2.0% 1.9% -4.3% 2.9% 3.3% 13.7%
    Tucson 2.5% 2.5% 1.8% 3.6% 5.0% 36.3%
    Total 7.5% 8.0% 6.4% 3.2% 4.4% 37.7%
    Other 1.0% 1.2% 12.3% 3.4% 4.2% 23.0%
    National Total 4.6% 5.0% 9.2% 3.3% 4.3% 30.9%
    Major metropolitan areas: Over 1,000,000 population in 2009
    Metropolitan Area definitions as of 2009
    Data from 2000 Census and 2009 American Community Survey

    The rise of working at home is illustrated by the number of major metropolitan areas in which it now leads transit in market share. In 2000, working at home had a larger market share than transit in 28 of the present 52 major metropolitan areas. By 2009, working at home led transit in 38 major metropolitan areas, up 10 from 2000. Between 2000 and 2009, the working at home market share increased nearly 6 times as much as the transit share in the major metropolitan areas (38.4% compared to 6.4%).

    Working at Home Leaps Above Transit In Portland and Elsewhere: Perhaps most surprising is the fact that Portland now has more people working at home than riding transit to work. This is a significant development. Portland is a model “smart growth” having spent at least $5 billion additional on light rail and bus expansions over the last 25 years. Portland was joined by other metropolitan areas Houston, Miami-West Palm Beach, New Orleans and San Jose, all of which have spent heavily on urban rail systems. Working at home also passed transit in Cincinnati, Hartford, Las Vegas, Raleigh and San Antonio (Table 2).

    Table 2
    Work at Home Share Greater than Transit
    Major Metropolitan Areas
    Atlanta Houston Norfolk Sacramento
    Austin Indianapolis Oklahoma City Salt Lake City
    Birmingham Jacksonville Orlando San Antonio
    Charlotte Kansas City Phoenix San Digo
    Cincinnati Las Vegas Portland San Jose
    Columbus Louisville Providence St. Louis
    Dallas-Fort Worth Memphis Raleigh Tampa-St. Petersburg
    Denver Miami-West Palm Beach Richmond Tucson
    Detroit Nashville Riverside
    Hartford New Orleans Rochester
    Indicates working at home passed transit between 2000 and 2009

    Further, the shares are close enough at this point that working at home could surpass n transit in Milwaukee, Cleveland and Minneapolis-St. Paul in the next few years.

    Transit: About New York and Downtown

    As noted above, transit also has gained during this decade. However, the gains have not been pervasive. Out of the 52 major metropolitan areas, transit gained market share in 29 and lost in 23. As usual, transit was a New York story, as the New York metropolitan area saw its transit work trip market share rise from 27.4% to 30.5%. New York accounted for 47% of the increase in transit use, despite representing only 37% in 2000. New York added nearly 500,000 new transit commuters. This is nearly five times the increase in working at home (106,000). Washington also did well, adding 125,000 transit commuters, followed by Los Angeles at 73,000 and Seattle at 41,000.

    Transit’s downtown orientation was evident again. This is illustrated by the fact that more than 90% of the increased use in the major metropolitan areas occurred in those metropolitan areas with the 10 largest downtown areas (New York, Los Angeles, Chicago, Philadelphia, Houston, Atlanta, Washington, Boston, San Francisco and Seattle). Among these, only Houston experienced a decline in transit commuting.

    Implications

    Working at home has been the fastest growing component of commuting for nearly three decades. In 1980, working at home accounted for just 2.3% of commuting, a figure that has nearly doubled to 4.3% in 2009. This has been accomplished with virtually no public investment. Moreover, this seems to have happened without any loss of productivity. Companies like IBM, Jet Blue and many others have switched large numbers of their employees to working at home. These firms, which necessarily seek to provide the best return on their investment for stockholders and owners would not have made these changes if it had interfered with their productivity.

    Over the same period, and despite the recent increases, transit’s market share has fallen from 6.4% of commuting in 1980 to 5.0% in 2009. At the same time, gross spending over the period rose more than $325 billion (inflation and ridership adjusted) from 1980 levels. Inflation adjusted expenditures per passenger mile have more than doubled since that time.

    Given the remarkable rise of telecommuting, its low cost and effectiveness as a means to reduce energy use, perhaps it’s time to apply at least some of our public policy attention to working in cyberspace. It presents a great opportunity, perhaps far greater and far more cost-effective than the current emphasis on new rail transit systems.

    ———-

    Note: Work trip market share reflects transit in its strongest market, trips to and from work. Transit’s overall impact, measured by total roadway and transit travel (passenger miles) is approximately 1%, compared to the national work trip market share of 5%.

    Wendell Cox is a Visiting Professor, Conservatoire National des Arts et Metiers, Paris and the author of “War on the Dream: How Anti-Sprawl Policy Threatens the Quality of Life

    Photograph: DDFic

  • Portland Metro’s Competitiveness Problem

    Portland Metro’s president, David Bragdon, recently resigned to take a position with New York’s Bloomberg administration. Bragdon was nearing the end of his second elected term and ineligible for another term. Metro is the three county (Clackamas, Multnomah and Washington counties) planning agency that oversees Portland’s land use planning and transportation policies, among the most stringent and pro-transit in the nation.

    Metro’s jurisdiction includes most of the bi-state (Washington and Oregon) Portland area metropolitan area, which also includes the core municipality of Portland and the core Multnomah County.

    Local television station KGW (Channel 8) featured Bragdon in its Straight Talk program before he left Portland. Some of his comments may have been surprising, such as his strong criticism of the two state (Washington and Oregon) planning effort to replace the aging Interstate Bridge (I-5) and even more so, his comments on job creation in Portland. He noted “alarming trends below the surface,” including the failure to create jobs in the core of Portland “for a long time.”

    Bragdon was on to something. Metro’s three county area suffers growing competitive difficulties, even in contrast to the larger metropolitan area (which includes Clark and Skamania counties in Washington, along with Yamhill and Columbia counties in Oregon). This is despite the fact that one of the most important objectives of Metro’s land use and transportation policies is to strengthen the urban core and to discourage suburbanization (a phenomenon urban planning theologians call “sprawl”).

    Anemic Job Creation: Jobs have simply not been created in Portland’s core. Since 2001, downtown employment has declined by 3,000 jobs, according to the Portland Business Alliance. In Multnomah County, Portland’s urban core and close-by surrounding communities, 20,000 jobs were lost between 2001 and 2009. Even during the prosperous years of 2000 to 2006, Multnomah County lost jobs. Suburban Washington and Clackamas counties gained jobs, but their contribution fell 12,000 jobs short of making up for Multnomah County’s loss. The real story has been Clark County (the county seat is Vancouver), across the I-5 Interstate Bridge in neighboring Washington and outside Metro’s jurisdiction. Clark County generated 13,000 net new jobs between 2001 and 2009 (Figure 1).

    Domestic Migration: Not only are companies not creating jobs in the three county area, but people are choosing to locate in other parts of the metropolitan area.

    Between 2000 and 2009, the three counties – roughly 75% of the region’s total population in 2000 – attracted just one-half of net domestic migration into the metropolitan area. Washington’s suburban Clark County, across the Interstate Bridge, added a net 48,000 by domestic migration and has accounted for 40% of the metropolitan area’s figure all by itself.

    Core Multnomah County, which had nearly double Clark County’s 2000 population, added only 4,000 net domestic migrants, at a rate less than 1/20th that of Clark County. Suburban Clackamas and Washington counties did better, but between them achieved barely one-half of the Clark County rate.

    Exurban Columbia and Yamhill counties, outside the jurisdiction of Metro but inside the metropolitan area, added nearly 13,000 domestic migrants, more than three times that of Multnomah County, despite their combined population less than one-fifth that of Multnomah’s in 2000.

    Effects of Pro-Transit Policies: Portland’s unintended decentralization has even damaged the much promoted, and subsidized, public transit agencies. Despite Portland’s pro-transit policies, the three county transit work trip market share fell from 9.7% in 1980, before the first light rail line was opened, to 7.4% in 2000, after two light rail lines had opened. Two more light rail lines and 9 years later, (2009) the three county transit work trip market share had fallen to 7.4%, despite the boost of higher gasoline prices. The three county transit work trip market share loss from 9.7% in 1980 to 7.4% in 2009 calculates to a near one-quarter market share loss. By contrast, Seattle’s three county metropolitan area, without light rail until 2009, experienced a 5% increase in transit work trip market share from 1980 to 2009 (8.3% to 8.7%).

    While taxpayer funded transit was attracting less than its share of new commuters out of cars, one mode –unsupported by public funds – was doing very well. Between 1980 and 2009, working at home rose from 2.2% of employment to 6.2%. in the four county area (including Clark County). Thus, nearly as many people worked at home as rode transit to work in 2009 (Note). Already, working at home accounts for a larger share of employment than transit in the larger 7 county metropolitan area. All of this is despite Portland’s having spent an extra $5 billion on transit in the last 25 years on light rail expansions and more bus service. (Figure 2).

    Why is the Three County Area Doing Less Well? Why have Portland’s policies that are designed to help the core failed to draw jobs and people? People who move to the Portland area from other parts of the nation are probably drawn by the lower house prices in Clark County, where less stringent land use regulation has kept houses more affordable. New housing in Clark County is also built on average sized lots, rather than the much smaller lots that have been required by Metro’s land use policies. House prices are also lower in the exurban counties outside Metro’s jurisdiction.

    As Metro has forced urban densities up in the three county area and failed to provide sufficient new roadway capacity, traffic congestion has become much worse. A long segment of Interstate 5 in north Portland seems in a perpetual peak hour gridlock unusual for a medium sized metropolitan area, which is obvious from Google traffic maps that show average conditions by time and day of week. Even more unusual is the gridlock on a long stretch of the US-26 Sunset Highway that serves the suburban Silicon Forest of Washington County. A long overdue expansion will soon provide some relief on US-26. However transportation officials seem in no hurry to provide the additional capacity necessary to reduce both greenhouse gas emissions and excessive travel delays on Interstate 5 in north Portland. People who move to Clark or the exurban counties can avoid these bottlenecks by working closer to home or even in the periphery of the three county area.

    Portland has important competitive advantages, such as a temperate climate and marvelous scenery. It also helps to be close to hyper- uncompetitive California, which keeps exporting households to neighboring states. But a higher cost of living driven by policies that have kept prices 40% higher than before the housing bubble (adjusted for household incomes), and increasing traffic congestion make Portland’s three county area less competitive and nearby alternatives more attractive.

    This is not surprising. More intense regulation deters business attraction and expansion. An economic study by Raven Saks of the Federal Reserve Board concluded that … metropolitan areas with stringent development regulations generate less employment growth. At least part of the reason the Metro region’s diminished competitiveness lies with a failed strategy that appears to be having the exact opposite effect to what has been advertised – and widely celebrated – among planners from coast to coast.

    Note: 1980 three county data not available on-line.

    Wendell Cox is a Visiting Professor, Conservatoire National des Arts et Metiers, Paris and the author of “War on the Dream: How Anti-Sprawl Policy Threatens the Quality of Life

    Photograph: South Waterfront Condominiums, Portland. Photo by author

  • California’s New Grassroots Movement: High-Speed Rail on the Peninsula

    In 2008, California voters approved Proposition 1A to allocate $9.95 billion of the state’s money to a high-speed rail system. Just two years later, many of these same voters are yelling and screaming at the High-Speed Rail Authority to revise their plans. Why have Californians turned against this project so quickly?

    Initially High Speed Rail seemed like a wise investment. The California High-Speed Rail Authority posts a video on its website of President Obama outlining the benefits of high-speed rail systems. However, by now this video seems a bit dated. In this April 2009 speech, Obama claims that not only would high-speed reduce travel time and emissions, but it would also decrease gridlock and save or create 150,000 jobs. It would be faster, cheaper, and easier. As if that were not enough to convince you, he goes on to say that the project is “on schedule and under budget.”

    Yet today, the California’s high-speed rail system has stalled. Citizens and state officials alike have lost faith in the rail authority to competently plan, fund, and build a rail line from San Francisco to Los Angeles. The project’s developers continue to scramble to secure funding.

    Not surprisingly, the cost of HSR in California has soared well above initial projections. Estimated costs for the first phase alone have risen from $30.7 billion in 2008 to $42.6 billion, adding over $10 billion to the original total of $45 billion. This is a problem. Though it received $9.95 billion in bonds through Proposition 1A, the California Rail Authority still must depend heavily on private business to foot a significant, and likely growing, portion of the bill. California treasurer Bill Lockyer has doubts that the rail authority will be able to sell the deal – due in part to a lack of consistent estimates in ridership or cost – to either potential bond-buyers or California consumers.

    Perhaps an even more serious problem has been caused by the hastiness with which California’s HSR is being developed. There often has been little consideration for local public opinion.

    A case in point lies on the Peninsula just south of San Francisco. The rail authority is hurrying to build on the Peninsula so that it can qualify for federal funding. But they have run into a flurry of complaints from city governments and citizens. Though it initially proposed building a trench system, essentially a shallow box for the train that would be covered at street crossings, it backed off on the idea in an August 6 application for federal monetary support. Instead, the Authority plans to run the line mainly on aerial structures to save money for later construction. “If the trench solution is selected,” it claims, “then less infrastructure could be implemented.” Since then it has switched to erecting aerial structures in Burlingame as well.

    Many cities along the Peninsula have rebelled over these abrupt adjustments. One of the primary arguments for high-speed rail has been to help the environment, but qualms about aerial structures are also rooted in environmental concerns. Menlo Park, Atherton, and later Palo Alto filed a lawsuit against the rail authority in 2008 in a partnership with four environmental groups, complaining that the authority did not conduct a thorough environmental review of the trench system before scrapping the idea. Judges in Sacramento are currently reviewing the authority’s plan to use the southern Pacheco Pass entrance from Merced, which the plaintiffs claim is less ecologically friendly. Decisions like these do not fit with California state environmental laws that require agencies to study several alternatives before approving a project.

    This lawsuit only made minor gains in addressing the cities’ complaints. While a Sacramento judge required the rail authority to make some concessions in the 2009 ruling, it sided with them on most of the issues, mainly because the state’s responsibility in this project remains unclear. However, recent developments over aerial structures have stimulated a tsunami of lawsuit threats. In one editorial, Martin Engel, a transportation commissioner for Menlo Park and opponent of California’s high-speed rail, rallies the Bay Area using a mob mentality: “Those towns that have refused to join the PCC out of fear of Atherton, Menlo Park and Palo Alto’s penchant for lawsuits, now have to re-assess their reluctance. Lawsuits are the only genuine legal negotiating tools at our disposal.”

    But, in reality, lawsuits are not the only weapons in the Peninsula’s arsenal. Democratic Assemblyman Jerry Hill of San Mateo has threatened to put high-speed rail back on the ballot if costs start to surpass initial estimates. This puts enormous pressure on the California Rail Authority since every day delayed means a rise in costs. If it does not secure the support of Peninsula cities soon, these extra expenses will push costs over the estimate and push the project back to the voters.

    San Mateo and Burlingame, though not involved in Atherton and Menlo Park’s original lawsuit, have just as much cause to complain. Almost one-third of the track crossings on the Peninsula would be in both cities. Building will certainly disrupt the businesses in the cities’ respective downtowns, many of which have flourished with locally owned boutiques and restaurants. Burlingame, “The City of Trees,” prides itself on the natural beauty of its neighborhoods. Cement walls carrying clamorous trains will undoubtedly disrupt this bucolic reality. If high-speed rail is put back on the ballot, it is likely that these cities will vote it down.

    Communities, not just city governments, are coming together to stop high-speed rail. The Community Coalition on High Speed Rail in Palo Alto, for example, is holding a presentation about the rail authority’s use of eminent domain in this project. The proposed elevated rail structure would displace residents, some permanently, and would lower the value of surrounding homes because of the elevated noise and traffic. The Coalition has been very active throughout the summer and will continue to fight for Peninsula residents.

    The already dire situation with Caltrain, the Peninsula’s current rail system, should provide a warning for city officials about the viability of high-speed rail. It has cut costs recently because of decreased ridership, which now averages 2,000 fewer riders per weekday compared to 2009, a 5% drop. Train stops have already been eliminated from Tamien in San Jose down to Gilroy. Caltrain’s experience has hardly shown the viability of expanded rail service.

    To some, high-speed rail epitomizes a new era of California infrastructure innovation. Yet a less sanguine reality is seeping in. Project costs continue to rise even as ridership estimates decline. The resulting increase in ticket prices creates even less of an incentive to choose rail over air travel. Even worse, the California Rail Authority is beginning to alienate potential riders from the Peninsula down to Los Angeles, many of whom could conceive of more useful ways to employ the state’s slender resources.

    Kirsten Moore is an undergraduate student at Chapman University and native of the Bay Area. She is a double major in history and screenwriting, focusing primarily on US social history.

    Photo of high speed rail station groundbreaking by mayorgavinnewsom

  • Light Rail & Left Turns

    Imagine that you own a service station that supplies fuel to the surrounding community, and you specialize in automotive repair. You’re proud that your reputation for service attracts vintage Corvette owners. You worked hard all of your life, and your shop is your equity for retirement. Your business is entirely dependent on customers who enter via a left turn from Boone Avenue, a low traffic street, because drivers cannot get direct access to you from Highway 55, just south of your business.

    One fateful day, a traffic engineer decides that the street serving as access to your station is to be cut off with a concrete median. This leaves no convenient access to your business; no left turn for your customers. Perhaps it was not intentional, but a lower level draftsman at a highway department, or an engineering consultant who never met you and only saw your business from a MapQuest image, decided that this concrete barrier was needed for some unknown-to-you reason. In what seemed like a blink of an eye, the business that you worked so hard all of your life to build was cut off.

    Your income, as well as the value of your business, plummets. Traffic engineers who have never met you have essentially destroyed your life’s earnings, as they drew a squiggle on a plan. Meanwhile the BP Station across the street is maintaining convenient access and flourishing.
    This is a true story. The barrier was installed, and what has remained for years since the business failed and was bull-dozed. It’s a vacant field in what would have otherwise been considered prime real estate.

    This video is an extremely well done representation of the new light rail that connects downtown Minneapolis with downtown St. Paul, right in the center of University Avenue, which is currently lined with hundreds of small businesses, including many small restaurants that are easily accessible from University Avenue by a left turn from half of the passing vehicles. While watching the video, did you notice that the light-rail in the street center eliminates left turns into businesses that are not at the few major intersections between Minneapolis and St. Paul?

    I admit that I’m no traffic engineer, and perhaps I’m not seeing the big picture, so please bear with my opinions, which I hope are based on common sense; you be the judge.

    Opinion #1: Build the light-rail and people will walk instead of driving their cars? Yes, in theory, people may use this new light-rail (based on old technology), and those people will surely choose walking over driving. But theory often conflicts with common sense. This “walkable” theory might work well in San Diego where every day has heaven sent weather. But in this region, there could be a month where 10 degrees below zero is the normal high temperature. Anyone ready for a leisurely stroll in that weather? Yes, there are many Minnesotans who do weather the weather, but many cannot. Going from a warm cozy home to the garage and leaving in the comfort of a car that heats up to toasty within minutes, and then parking close to a destination (in the cold winter or the sweltering summer) is hard to compete with.

    Opinion #2: Building a barrier down the center of a street cannot be good for business. When driving, the only way to access the vast majority of the businesses on the opposite side of the street is to drive a distance to the next major intersection, then make a (probably illegal) u-turn and drive all the way back. Given this choice, most potential customers will bypass the business, and some may choose to stop at the competition on the convenient side of the street.

    Opinion #3: The light rail will result in a considerable increase in fuel usage. Let’s not touch on the logic, argued by some, that the light rail saves energy because people are not in their cars, but instead concentrate just on how residents will get to and from their homes when they are driving. Assuming that the route by car will use University Avenue, which is based in a tight old urbanist (just like new urbanist) grid pattern, it is quite easy and convenient to get home, which is possibly a reason that so many like to live in these areas. Alas, no more of that convenience after the light rail bisects University Avenue. The likely scenario is that you make the left turn and then continue on the high density grid streets to your home. If you live closer to the next intersection, you are likely to continue at a higher speed along University Avenue and then make two left turns to get home. Ultimately, in both cases you will encounter more intersections, which means more accelerate-slow-stop cycles that consume energy and time, and increased distances, which also mean more time and energy. Whatever savings result from the light-rail in the middle of the street are not close to the extra energy consumed by the newly inconvenient vehicle routes.

    Opinion #4: Pedestrians are more endangered by the newly-complex train and traffic scenario. Do all drivers on busy streets stop for the pedestrian in the cross-walk? This one comes close to home. We have a cross-walk between our home in St. Louis Park the coffee shop on Minnetonka Boulevard, a street with much less traffic than University Avenue. My wife insists that we should simply walk across when cars are zooming past, telling me that it’s the law, they must stop. Well, they don’t always. Sometimes a driver in a left lane stops, but the right lane drivers do not see the pedestrian until it’s too late. The video (linked above), shows cars slowing down and stopping at the cross-walks for pedestrians to enter the train station. I’m not so sure that will work out as well on a busy street that’s been made slightly more complex by the light-rail smack in the middle.

    Opinion #5: Pedestrians are about to have a much longer walk. Let’s say you live south of the Light Rail line, between two major intersections, and want to walk across University Avenue to a restaurant on the north side for that delicious Pad Thai you have enjoyed so much for the past 15 years, just a block away. It is a typical January evening, dark, and 25 degrees BELOW zero. Huh, that Light Rail line does not allow you to cross the street, so you go that one block to University, and just 150 feet away is the restaurant – you can taste the Pad Thai! You venture ¼ mile to the next cross walk, cross University, and tread another ¼ mile back to the restaurant. You stop shivering about the time dinner is served. After the meal the wind picks up and the wind chill is 40 below zero. By the time you get home, you cross your favorite restaurant off your list of regular visits. You no longer even think about that side of the street if it is icy; one slip and brittle bones shatter. While this can happen anywhere, creating longer walking distances instead of shorter ones will surely increase the risk.

    A related problem: If you Google Map University Avenue today you will notice parallel parking along both sides of University Avenue in much of its business district. In the video, those spaces are eliminated. This means that all drivers will become pedestrians, trekking longer distances to the businesses. The driving customers must park somewhere… how does that work?

    Opinion #6: Eliminate the light-rail and replace it with a PRT (Personal Rapid Transit) or elevated rail. An elevated PRT or rail system would not require the current vehicular system to change much, it might be able to be built with little interruption to businesses, and certainly the business along both sides of University Avenue will continue apace. Snow? No problem with an elevated system . Of course an elevated system does not interfere with vehicular traffic, and as such would still promote driving. Was the “driving” force behind the ground-based design for the light-rail intended to disrupt cars? Logic suggests that this might be the case.
    Why do we still, in 2010, continue to build transportation systems that have their basis in century old technology? If Dr. Spock from StarTrek was in charge at the DOT, he would certainly find this illogical. And Captain Kirk would surely want elevated systems to zip us off to our destinations at warp speed – don’t you think?

    I’m not convinced that our traffic engineers are as dedicated to a roundabout (see http://www.rhsdplanning.com/roundabout/roundabouts.swf) and light- rail path as our politicians are. I have talked to many engineers over the years that do not seem to be “all on board”.

    If the vision in the video is an accurate representation of how our future will look, Ford Motor Company will be the major winner in this deal. Check it out: It sure looks like the vast majority of cars driving along University Avenue in the future will be new Silver Mustangs – better buy yours today!

    Photo: ‘Go West Young Man’ by TheeErin

    Rick Harrison is President of Rick Harrison Site Design Studio and Neighborhood Innovations, LLC. He is author of Prefurbia: Reinventing The Suburbs From Disdainable To Sustainable and creator of Performance Planning System. His websites are rhsdplanning.com and performanceplanningsystem.com.

  • Missing the Point on Jobs: The “More Transit – More Jobs” Report

    The Transit Equity Network has just published a study called More Transit – More Jobs in which it suggests switching 50% of highway funding to transit in 20 metropolitan areas to create an additional 180,000 jobs over the next five years. Their basic thesis is that each kajillion in spending can produce more jobs in transit than in highways. We don’t comment on that, because, frankly, the purpose of transportation spending is neither to create transit jobs nor highway jobs.

    We spend on transit and highways because of benefits that extend beyond any direct employment. And, the extent of those benefits cannot be compared between the two modes. At current rates of spending each billion dollars spent on highways supports about 25 times as much personal mobility as one spent on transit. Beyond that, highway spending supports the movement of more than 1.25 billion ton miles of truck freight, which keeps product prices low and supports our affluent life style. Transit carries 0.0 ton miles of freight. Researchers such as Prud’homme & Chang-Wong and Hartgen & Fields have shown that the type of ubiquitous mobility provided by road systems produce greater economic growth. Moving money out of roads would increase traffic congestion, destroy jobs and increase product prices by slowing down trucks.

    Why, on earth, then would anyone make such a dubious proposal? To paraphrase Bill Clinton, “It’s the ideology, stupid.” As we wrote within the past week, much of transportation spending over the last 25 years has been solidly based in an anti-mobility ideology that has produced virtually nothing in return. Already, transit, which accounts for one percent of national travel and no freight movement, accounts for more than 20% of spending on highways and transit combined. Things would be better if that were raised to 60%?

    If the Transit Equity Network were right (which it is not), then why stop at 50% for transit? Why not take all of the transit and highway money and just employ people to dig holes with shovels and then fill them up again. The only costs would be wages, benefits, shovels and administration. We could save money by not buying concrete, rails, fancy trains or palatial administrative buildings. Another advantage is that the holes would require no longer term operating subsidies.

    So, we need to do more than dump the ideology. We need also to dump the stupidity. Government does not exist for the purpose of government services and transportation programs do not exist for the good of transportation employees or vendors. Each dollar of infrastructure expenditures should be used to facilitate the greatest economic benefit throughout society as a whole, not just among people employed in transit (or highways for that matter).

  • Strikes and Transit Alternatives in London

    The Wall Street Journal notes that the London Underground (metro or subway) is on strike and that transit riders are having to find alternate ways to get around. This is of course, not good news, and the transit strikes that happen often in places like Paris and periodically in places like Los Angeles and Philadelphia are a serious impediment to transit’s growth (along with spending on extravagant projects and excessive and rising operating costs).

    But London is actually well prepared for this emergency. Unlike Paris, Chicago and New York (where making transit strikes illegal did not prevent one), London’s buses and underground are organized in a manner that provides riders with an alternative.

    The key is competitive tendering (competitive contracting) of bus service. One of the Thatcher government’s most successful reforms was its reorganization of transit in London. It began in 1985, when a small part of the world’s largest public bus system was put out to competitive bid. London Transport retained control of the schedules, fares, logos and bus liveries, so that the now privately operated services were an integral part of the system. Riders did not know the difference between the public and private services, until a few years later when the privately operated services began achieving better service reliability than the public services.

    By 2000, the entire London bus system had been converted to competitive tendering, with multiple contractors providing the service. Costs per mile dropped by 50%, adjusted for inflation, while service was expanded and ridership rose. Regrettably, some of the efficiency gains were lost once Ken Livingstone assumed the mayorality of the new Greater London Council, while Transport for London (the successor to London Transport) failed to pay sufficient attention to retaining economic competitiveness between the contractors. Still, things are far better today than they were 25 years ago.

    This competitively tendered bus system makes it possible for underground riders to get to their destinations by bus, albeit somewhat more slowly.

    Having an alternative is crucial. I recall that in response to a Southern California Rapid Transit District (SCRTD) bus strike (Note), I asked the Torrance and Gardena bus operations to “open their doors” as they traveled through low-income south central Los Angeles on their way to downtown (regulatory restrictions required them to operate in “closed door more” so as not to compete with the services of the larger Southern California Rapid Transit District). It was not long before one of my fellow Los Angeles County Transportation Commission members complained to Mayor Bradley (who had appointed me), which resulted in my withdrawal of the request. My colleague had been more concerned about the good of already well compensated transit employees to a greater extent than south central Los Angeles residents who relied on the buses for their livelihood (granted, this geographic area was outside the electoral constituency of the member).

    It is well to remember the less than sage views of Herbert Morrison, Deputy Prime Minister to Clement Atlee in the United Kingdom in the late 1940s. Morrison, the founder of the publicly operated London Transport opined that conversion of privately operated services to publicly operated services would be more efficient and better serve the public because public employees would be driven by an ethic of public service. While Nobel Laureate James Buchanan and the public choice school of economics put an academic end to such muddled thinking, London Underground’s workers are in the process of providing even more tangible evidence.

    —-

    Note: SCRTD was the operating predecessor to the current Los Angeles County Metropolitan Transportation Association. The board on which I served, the Los Angeles County Transportation Commission was the policy predecessor.

    Photograph by the Author

  • A Mass Transit New England Ramble

    To escape the summer crowds in the Hamptons, I rode the S92 bus (fare $1.50) for almost three hours, as it cruised the south and north forks of Long Island, before leaving me at the ferry that connects Orient Point to New London, Connecticut.

    I might end up late to some meetings, but this way I could monitor the progress of the American Recovery and Reinvestment Act of 2009, at least as it pertains to the more than $8 billion earmarked for high-speed trains, if not buses and ferries.

    Not many Hampton People leave on a local bus, which in this case was filled with Latino day laborers, giving it the air of a John Steinbeck novel. I was headed to New England, and I wanted to see if I could make a circuit to Providence, Boston, Amherst, and Keene entirely on public transportation.

    Conclusion: Mass transit works better as a White House sound bite than as a way to get around New England.

    The S92 rolled through the Hamptons to Riverhead, the county seat, where the Latinos got off, leaving me with the driver (from Masuria in Poland) to pass by the North Fork vineyards, which are vast and sophisticated. When I was young, only winos drank Long Island vintages; now it can cost $40 a bottle.

    The ferry to New London made the crossing in local fog banks, which obscured Plum Gut, but parted for the run into New London, the American Gibraltar. I saw a surfacing submarine and, at the ferry terminal, a sculpture of the playwright Eugene O’Neill, shown as a boy gazing out to sea (even though he spent most of his adult life looking at bad marriages rather than the waves).

    The train to Providence ran along the snug harbors around Mystic and Stonington, although inexplicably it arrived forty-five minutes late. Brown University and some local technology companies are the reason that the Rhode Island capital does not feel like a failed mill town. My friend on the local newspaper whispered that the well reputed university is long on celebrity children, and short on academic excellence.

    I switched to the Massachusetts Bay Transportation Authority (MBTA) for the hour run into Boston’s Back Bay Station. It ran with the air conditioning on full blast, as if it were a rolling meat locker. The rail car had wifi, a commuter train novelty for me, and much appreciated.

    The $15 billion Big Dig, to bury the city’s interstates, not to mention the U.S. Treasury, is largely completed. Even so, much of downtown feels like an exit ramp, usually named after one of the Kennedys. Boston is not one of the cities where I am at home, but I appreciate the glimpses of the Freedom Trail and thinking I might have to make way for ducklings.

    After my Boston meetings, I headed for Amherst in central Massachusetts. Traveling by bus would have meant changing in Springfield, as would have Amtrak (estimated travel time, about four hours). Instead, I took a MBTA commuter train to North Leominster, a gritty mill town now given over to Jiffy Lube and donuts.

    The Amherst area has thousand of students from eastern Massachusetts, but few plans to improve its bus or train connections. Nor is it possible to take public transportation from Amherst one hour north to Keene, New Hampshire. Had I wanted to do so, I would have had to first go south to Springfield, then back up to Bellows Falls, Vermont, spend the night, and connect the following morning to Keene on Greyhound (“safe, reliable, courteous, and slow”).

    I surrendered and rented a car.

    Before leaving Amherst, I visited the Emily Dickinson House, where I had the good luck to join Ms. Casey Clark’s tour. She made the reclusive Emily come to life: by quoting from her work (“Forever is composed of nows”), and pointing to the solitary window table where Dickinson wrote many of her 1,800 poems, the passionate Tweets of the nineteenth century.

    I had not been to Amherst College since October 1963, when as a nine-year old boy I was taken to see President John F. Kennedy dedicate the new Robert Frost Library.

    On this visit, I recalled seeing JFK’s helicopter land on the football field, and his motorcade along the main street. His bright red hair and toothy smile are etched in memory. He sat on the back of an open car; the President as prom queen. Even to a rapturous boy, he looked vulnerable. Less than a month later, he died in the same convertible.

    For the benefit of my university-bound children, I joined a campus tour. After exhaustive inspections of laundry rooms, showers, dorms, lounges, and food courts — why are colleges marketed as subdivisions? — I gave up and drove to Brattleboro, Vermont, another mill town that is trying make a go of spinning cappuccino.

    My New England ramble ended on Amtrak’s Vermonter, a train that goes from northern Vermont to Washington, probably in about the same amount of time that the Indians took to make the journey in canoes. The train poked across Massachusetts, idled in Springfield, and then picked up speed south of Hartford, where we crossed the Connecticut River.

    The biggest problem with American public transportation is that it lacks a critical mass. The infrequent service is more of a problem than the slow speeds, which could be padded over with comfortable seats, wifi, and better coffee. Amtrak has only one train a day north of Springfield, which in turn has one train to Boston and spotty bus service. Little wonder everyone drives.

    Why throw money at high-speed rail when Amtrak runs on such dilatory schedules? Spend the money, instead, on more traditional rail cars and engines, which are in short supply, or hire some Swiss conductors and engineers to keep to the schedules.

    Amherst to Princeton, New Jersey, where I was headed, is a five–hour car ride. I made the trip by train in a leisurely eight hours, with the proximity of an AmCafé and a power outlet for my computer, to write this article.

    I appreciated not having to drive on the interstate or sit on a cramped bus, although the station waits were maddening. The train crew changes were frequent, suggesting a company hostage to union rules and feather bedding. To my knowledge, Emily Dickinson never wrote a poem about Amtrak. If she had, it might read:

    I cast my Fate upon the Rails –
    As if a spirit on Indian trails –
    We stopped, and shuddered, and watched our steps –
    And sweated during A/C fails

    Leaving out the $80 cost of the rental car, my travels cost less than $125. And although I loved being on trains and ferries, there is something shabby about public transportation, as though it’s headed for obscurity, rather than for the President’s brave, new high-speed world.

    Back home, the question on my mind was: If you had $8 billion, would you let Amtrak manage it?

    Matthew Stevenson is the author of Remembering the Twentieth Century Limited, winner of Foreword’s bronze award for best travel essays at this year’s BEA. He is also editor of Rules of the Game: The Best Sports Writing from Harper’s Magazine. He lives in Switzerland.

    Photo: Black-backed gull and Sea Jet high-speed ferry, New London, Ct.
    By L’eau Bleue

  • What’s Behind China’s Big Traffic Jam

    The world press has been fixated on the “Beijing” traffic jam that lasted for nearly two weeks. There is a potential lesson here for the United States, which is that if traffic is allowed to far exceed roadway capacity, unprecedented traffic jams can occur.

    The Inner Mongolia Traffic Jam: First we need to understand that this was not a “Beijing” traffic jam at all,or even on the outskirts of Beijing. The traffic jam came no closer to Beijing than 150 miles (250 kilometers) away, beyond the border of the city/province of Beijing, through the province of Hebei and nearly to the border of Inner Mongolia. The traffic jam then extended for more than 60 miles (100 kilometers) from near the Inner Mongolia border to Jingxi, in the region/city of Ulanqab. In reality this would be like calling a New York City traffic jam something that originated from Springfield, Massachusetts to Boston’s I-495 beltway (Figure 1).

    However, even the New York City example understates the complexity of the Chinese traffic jam. Beijing, China’s national capital, is one of the world’s largest urban areas (with a population of nearly 14 million). The city is situated at the northwestern limit of the densely populated part of China (which is called “China Proper”) that runs from Manchuria in the north to Yunnan in the south.

    Beijing’s urbanization ends at the mountains less than 30 miles from the Forbidden City, Beijing’s core. The area beyond the mountains, through which the Great Wall runs, possesses only intermittent and generally minor urbanization. The area is dominated by grassland, and some rice farming. In this environment, it is not surprising that there were few alternatives for traffic to the G-110 Expressway (freeway), just as there would be few alternatives for traveling between Casper and Cheyenne, Wyoming on Interstate 25.

    Continuing the I-25 comparison, the Inner Mongolian traffic jam more closely resembled traffic destined for Denver, with the congestion stretching from north of Cheyenne for another 60 miles, not far from the south end of the Powder River Basin, America’s largest coal producing region. This is a particularly appropriate comparison, because the type of traffic that caused the Inner Mongolian jam, coal trucks, would similarly jam I-25, were it not for the high-capacity freight rail system that moves most of the coal from the Powder River Basin to the nation’s electricity generation plants in the Midwest, East and South.

    Like Interstate 25, the G-110 Expressway is a high quality divided and grade separated four lane road. As with Wyoming’s I-25, Inner Mongolia has an old 2-lane road (National Route 110) that parallels the G-110 for much of the way. This is not a viable alternative for the truck traffic volumes that are needed to supply the megacity of Beijing with its electric power.

    Beijing’s First World Traffic: The Beijing city commission has announced that traffic flows continue to slow in Beijing. In the first half of 2010, the average speed dropped to 14 miles per hour (24 kilometers per hour). This is despite the fact that the urban area has a world class expressway system, with a fifth ring expressway (beltway) mostly completed (Note 1) and radial expressways feeding the inner areas. The surface arterial system in the inner area consists of a dense network of wide streets, providing capacity that certainly exceeds that of the city of Chicago or the four highly urbanized boroughs of New York, Manhattan, Brooklyn, the Bronx, and Queens (Note 2).

    Beijing’s inner area traffic congestion is like that of New York City. The population density is 30,000 people per square mile (the approximate density also of the four New York boroughs), too high to move the volume of traffic over a freeway and expressway system. Higher population densities are associated with greater traffic congestion, slower speeds, stop and go traffic and more intense pollution. Beijing and New York share all of these conditions.

    There is a perception that the traffic situation could become substantially worse in Beijing, and that could well be the case. However, it is surprising that the Bejing (the city/province) is already well along in private vehicle ownership and use. Beijing has achieved a car ownership rate almost equal to that of New York City’s dense boroughs. In 2008, the dense boroughs of New York City had 0.52 cars per household, while Beijing had achieved a 0.51 rate. One report now places Beijing’s car ownership one third higher than in 2008, which would place Beijing’s car ownership rate 20% above that of New York City.

    By 2008, Beijing already had 1.5 times as many drivers per household as New York City’s dense boroughs (Figure 2). The difference appears to be in commercial drivers licenses, which account for nearly one-half of Beijing’s 9.4 million driver’s licenses. With the coal truck traffic and heavy truck traffic to the port of Tianjin, little more than 100 miles (160 kilometers) away, it is possible that trucks comprise a higher share of the traffic volume in Beijing than in New York City (Note 3).

    Local authorities are seeking to reduce the traffic congestion problem by building one of the world’s largest Metro (subway) systems. By the middle of the decade, nearly 350 miles (561 kilometers) should be open. Some lines will extend to outside of the fifth ring road, where much of the population growth is occurring. The Beijing Metro, like that of Mexico City, has been designed to better serve the contemporary urban area. Both are characterized by a concentration of grid routes and less by radial routes. Beijing also has ring routes. This design is especially appropriate for Beijing, which as is typical for many large Asian urban areas and unlike New York, Chicago or Hong Kong, has a decentralized core. Large office buildings in the center are more sparsely spread around a larger area, larger than these concentrated central business districts. Yet, even with this appropriate route design, the decentralization of retail and office activity necessitates time-consuming transfers that can make cars faster, even in Beijing’s traffic.

    China is also encouraging the use of electric cars, subsidizing buyers willing to switch from cars powered by fossil fuels. This will not ease traffic congestion, but it will reduce air pollution.

    At the same time, a period review of traffic conditions on the Internet will show Beijing’s worst traffic congestion to be concentrated in the high density core while in the much less dense expanding suburbs, traffic conditions are considerably better. Additionally, there is discussion of a seventh ring road and Beijing officials continue to improve their roadway network. As in US urban areas, Beijing’s continued decentralization could allow traffic to eventually be managed. Economists Peter Gordon and Harry W. Richardson have found that “suburbanization has been the dominant and successful mechanism for reducing congestion.”

    Clearing the Traffic: Meanwhile, there are reports that authorities have eased the traffic jam in Inner Mongolia. A longer term solution might be to add a couple of additional lanes in each direction. This should not be too difficult in a nation that by the end of the year will have nearly as many miles of freeway (43,000 or 70,000 kilometers) as the original US interstate system and will probably lead the world early in the next decade. This is a key to improving the competitiveness of Chinese urban areas. Sufficient roadway investment to handle growing travel demand will be just as important to maintain the competitiveness of US urban areas.

    —-

    Note 1: Beijing has six ring roads, however the first is the arterial road surrounding the Forbidden City, which is not an expressway.

    Note 2: Staten Island is excluded because its urban form is principally that of a post-war suburb, with a much lower population density.

    Note 3: This assumes comparability of data, which may not be fully reliable due to incomplete information.

    —-

    Wendell Cox is a Visiting Professor, Conservatoire National des Arts et Metiers, Paris and the author of “War on the Dream: How Anti-Sprawl Policy Threatens the Quality of Life

    Photo of Beijing Fourth Ring Road by archlife

  • Commuter Rail Brings Slower Transit in Austin

    Commuter rail is often sold to the public as a faster means of travel than buses. This can be true if the drive to the park and ride lot is short and your destination is within walking distance of a station. However, it is apparently not true in Austin.

    The Austin American-Statesman reports that bus riders showed up at a Capital Metro hearing this week to oppose cancellation of two express bus routes that parallel the new commuter rail line. Their complaint? Taking the train takes longer.

    As has become typical for new urban rail projects, Austin’s commuter rail line is carrying considerably fewer riders than projected. During its first month of service, daily ridership averaged 900 (450 each way), less than one-half the projected 2,000. This is less than 1/100th of Capital Metro’s daily bus ridership.

  • Mass Transit: The Great Train Robbery

    Last month promoters of the Metropolitan Transit Authority’s Los Angeles rail projects, both past and future, held a party to celebrate their “success.” Although this may well have been justified for transit-builders and urban land speculators, there may be far less call for celebration among L.A.’s beleaguered commuters.

    Despite promises that the $8 billion invested in rail lines over the past two decades would lessen L.A.’s traffic congestion and reshape how Angelenos get to work, the sad reality is that there has been no increase in MTA transit ridership since before the rail expansion began in 1985.

    Much of the problem, notes Tom Rubin, a former chief financial officers for the MTA’s predecessor agency, stems from the shift of funding priorities to trains from the city’s more affordable and flexible bus network. Meanwhile, traffic has gotten worse, with delay hours growing from 44 hours a year in 1982 to 70 hours in 2007.

    Sadly, this situation is not unique to Los Angeles. In cities across the country where there have been massive investments in light rail–from the Portland area to Dallas and Charlotte, N.C., and a host of others–the percentage of people taking transit has stagnated or even declined. Nationwide, the percentage of people taking transit to work is now lower than it was in 1980.

    None of this is to argue that we should not invest in transit. It even makes sense if the subsidy required for each transit trip is far higher than for a motorist on the streets or highways. Transit should be considered a public good, particularly for those without access to a car–notably young people, the disabled, the poor and the elderly. Policy should focus on how we invest, at what cost and, ultimately, for whose benefit.

    In some regions with large concentrations of employment, downtown major rail systems often attract many riders (although virtually all lose lots of money). The primary example would be the New York City area, which is one of only two regions (the other being Washington, D.C.) with over one-fifth of total employment in the urban core. In the country as a whole barely 10% of employment is in the city; and in many cities that grew most in the 20th century, such as Dallas, Miami, Los Angeles and Phoenix, the central business district’s share falls well under 5%.

    Some other urban routes–for example between Houston’s relatively buoyant downtown and the massive, ever expanding Texas Medical Center–could potentially prove suitable for trains. But most transit investments would be far more financially sustainable if focused on more cost-efficient methods such as rapid bus lanes, which, according to the Government Accountability Office, is roughly one-third the cost of light rail.

    Making the right choices has become more crucial during the economic downturn, even in New York City. The city and the federal government continue to pour billions into a gold-plated Second Avenue subway but now plan to cut back drastically on the bus service that serves large numbers of commuters from the outer boroughs and more remote parts of Manhattan.

    Ultimately the choice to invest in new subways and light rail as opposed to buses reflects both a class bias and the agenda of what may best described as the “density lobby.” The people who will ride the eight-mile long Second Avenue subway, now under construction for what New York magazine reports may be a total cost of over $17 billion, are largely a very affluent group. The new subway line will also provide opportunity for big developers to build high-density residential towers along the route. In contrast, the bus-riders, as the left-of-center City Limits points out, tend to be working- and middle-class residents from more unfashionable, lower-density districts in the Bronx, Queens, Brooklyn and Staten Island.

    The proposals for High Speed Rail–a favorite boondoggle of the Obama administration and some state administrators–reveals some of the same misplaced fiscal priorities. California’s State Treasurer, Democrat Bill Lockyer, has lambasted the proposed HSR line between Los Angeles and the Bay Area, suggesting the state may not be able to sell private investors on between $10 billion and $12 billion in bonds without additional public subsidies.

    Other prominent Democrats as well as the State Auditor’s office have challenged the promoters’ claims about the viability of the system and its potential drain on more reasonable priced transit project.

    This issue funding priorities was raised recently by the current administrator of the Federal Transportation Authority, Peter Rogoff, who questioned the wisdom of expanding expensive rail and other transit projects when many districts “can’t afford to operate” their own systems. He noted that already almost 30% of all existing “transit assets” are in “poor or marginal condition.”

    Ultimately we need to ask what constitutes transit’s primary mission: to carry more people to work or to reshape our metropolitan areas for ever denser development. As opposed to buses, which largely serve those without access to cars, light rail lines are often aimed at middle-class residents who would also be potential buyers of high-density luxury housing. In this sense, light rail constitutes a critical element in an expanded effort to reshape the metropolis in a way preferred by many new urbanists, planners and urban land speculators.

    The problem facing these so-called visionaries lies in the evolving nature of the workplace in most parts of the country, where jobs, outside of government employment, are increasingly dispersed. Given these realities, transit agencies should be looking at innovative ways to reach farther to the periphery, in part to provide access to inner-city residents to a wider range of employment options. Considering more than 80% of all commuter trips are between areas outside downtown, priority should be given to more flexible, less costly systems such as rapid commuter bus lines, bus rapid transit, as well as subsidized dial-a-ride and jitney services that can work between suburban centers.

    If reducing energy use and carbon emissions remains the goal, much more emphasis should be placed as well on telecommuting. In many cities that have invested heavily in rail transit–Dallas, Denver and Salt Lake City, for example–the percentage of people working from home is now markedly larger than those taking any form of mass transit. Since the approval of the Dallas light rail system in the 1980s, for example, the transit share of work trips has dropped from 4.3% to 2.1%; the work-at-home share has grown from 2.3% to 4.3%.

    In fact, people who work from home now surpass transit users in 36 out of 52 metropolitan areas with populations over 1 million–and receive virtually no financial backing from governments. Yet if New York, home to roughly 40% of the nation’s transit commuters, was taken out of the calculations, at-home workers already outnumber the number of people taking transit to work; and since 2000 their numbers have been growing roughly twice as fast as those of transit riders.

    Clearly we should not spend our ever more scarce transit resources on a nostalgia crusade to make our cities function much the way they did in the late 1800s. Instead, we need to construct systems reflecting the technology and geographic realities of the 21st century and place our primary focus on helping people, particularly those in need, find efficient, economically sustainable ways to get around.

    This article originally appeared at Forbes.com.

    Joel Kotkin is executive editor of NewGeography.com and is a distinguished presidential fellow in urban futures at Chapman University. He is author of The City: A Global History. His newest book is The Next Hundred Million: America in 2050, released in February, 2010.

    Photo: Michael | Ruiz