The potential for a symbiotic relationship between the environment, cars and people may be about to take a giant leap forward. London’s Daily Telegraph reports that a group of engineers from Genco have developed a bio-bug (Volkswagen bug) that runs on human waste. The car is powered for 10,000 miles from the excrement from 70 households (annually). The human waste bio-bug would be carbon neutral because it would not add any greenhouse gas to that already produced. The fuel would be produced at sewage plants, which already produce the necessary methane fuel from waste. While the technology, fully implemented, would not produce sufficient methane to power the entire fleet of cars, it would be a significant step forward and is further indication of the potential for technology to make substantial greenhouse gas emission reductions.
Tag: Transportation
-
Transit in Los Angeles: Celebrating the Wrong Thing
Los Angeles area transit officials celebrated 20 years of urban rail at a Staples Center event on July 23. Over the past 20 years, Los Angeles has opened 2 metro (subway) lines, 4 light rail lines and two exclusive busways (though apparently busways aren’t worth celebrating). Surely, there is no question but that Los Angeles has been successful in opening a lot of new transit infrastructure.
At the same time, however, The Los Angeles Times reported that Professor James Moore of the University of Southern California, blames the disproportionate financial attention paid to rail projects reduced transit ridership by 1.5 billion (with a “b”) over the same period. The reason is, as Tom Rubin put it, is that many more people can be carried for the same money on buses, “Had they run a lot of buses at low fares, they could have doubled the number of riders.” Rubin was chief financial officer of the Southern California Rapid Transit District, one of the two predecessors of the present transit agency (MTA). The other was the Los Angeles County Transportation Commission, to which I was appointed to three terms.
Transportation experts were also quoted to the effect that the rail system has done little to reduce traffic congestion or increase the use of mass transit much beyond the level in 1985, when planning for the Metro Blue Line began. Indeed. Traffic congestion has gotten much worse, and traffic volumes have increased materially. Our recent article showed that transit market shares had declined.
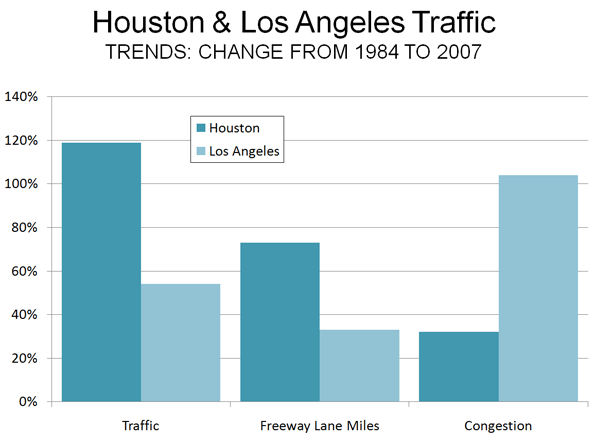
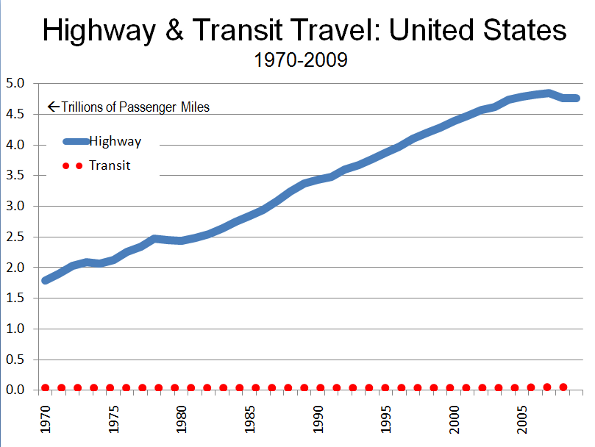
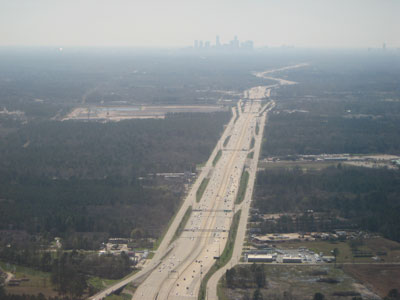
These results are in stark contrast to Houston, which in 1984 had the worst traffic congestion in the nation. Houston set about to solve the problem by expanding its roadway capacity. Since 1984, Houston’s traffic grew twice as fast as that of Los Angeles, and population grew three times as fast (at least in part because many Californians were moving to Texas). Houston also added freeway mileage at double the percentage rate of Los Angeles. The reward was an increase in traffic congestion less than one-third that of Los Angeles (Figure). The most recent INRIX Scorecard shows Los Angeles traffic congestion to be more than 2.5 times as intense as Houston’s.
Spending money on the right things makes a big difference. One can only wonder how different things might have been if Los Angeles had invested in the capacity people need (more roads) rather than in politically correct transit facilities that have no potential to reduce traffic congestion or to improve mobility and economic performance.
 There is a lesson from Los Angeles experience both for other areas and other government functions. The test of government performance is outputs, not inputs. Thus, it is appropriate to celebrate large transit market share increases or significant improvements in student achievement, not how many miles of rail are built or how much money is spent on education.
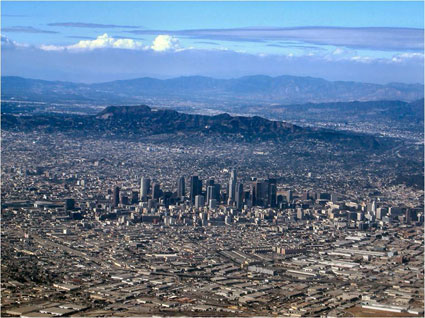
Photograph: Los Angeles and the San Fernando Valley (by the author)
-
The Fifth Estate Clarifies US Driving and Transit Figures
Late on July 26 (Washington time), The Fifth Estate corrected the attribution by Professor Peter Newman of Curtain University to the effect that driving was down 43% and transit up 65% in the United States. This issue had been the subject of my column on the same morning. It was a simple decimal error (in the reporting) and has now been corrected on the site. Driving is now reported as being down 4.3% and transit up 6.5%. Professor Newman provided slides with the data to Ms. Tina Perinotti, who forwarded them to me.
While the new figures are less inconsistent with the official figures than the former, there are still material inconsistencies.
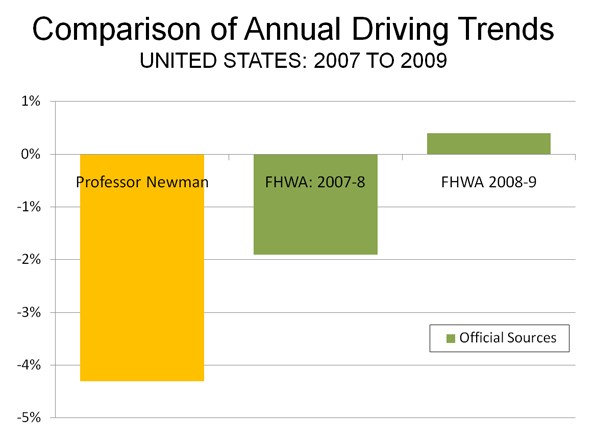
Driving Trend: Official Data: The slides provided simply refer to the two figures as relating to the past year, without a source or specific period. The 4.3% driving decline is more than double the largest annual decline reported by the official source for such information, the Federal Highway Administration (Figure 1).
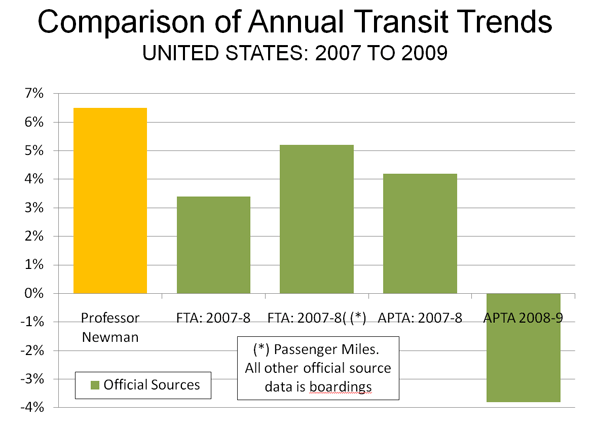
Transit Trend: Official Data: We reviewed the data published from the official sources for transit data (the American Public Transportation Association and the Federal Transit Administration) and found no recent annual data indicating a 6.5% increase in ridership (either in boardings or in passenger miles). Much of the transit ridership gain from 2007 to the peak year of 2008 was lost in 2009, according to data posted by APTA in early March (Figure 2). A later first quarter report by APTA indicates further losses. Moreover, as we indicated in our article, the percentage decline in transit use since the peak year of 2008 is many times that of the decline in driving.
Not All Percentages Are the Same: Care must also be used in comparing percentage changes between transit and driving, because so little travel is on transit. For example, a one percent increase in roadway urban travel converts to about one-third of a mile per person per day. A one percent increase in transit use converts to about 30 feet per person per day, about the same distance as walking from one side to the other of the average bedroom and back.
Note: It is possible that the 4.3% driving decline was taken from an interim Federal Highway Administration report indicating that driving declined 4.3% in March 2008 compared to March 2007 (a monthly comparison, not a year on year comparison). This FHWA report, however, is subject to annual revision based upon the more comprehensive Highway Performance Monitoring System, which in 2009 revised the March 2008 such that the annual change became 2.7%.
-
Going Underground in Australia
Just over a decade ago, governments in Australia were immune to calls for accelerated infrastructure investment in our major urban centres. Plans for strategic reinvestment were rare. Much has changed in that time, maybe too much. It seems that enthusiasm for major urban infrastructure now runs ahead of impartial assessment of the cost, versus the claimed benefits. A proposed $8.2 billion underground rail loop for Brisbane, along with a new underground station for its busy downtown, provides one example of an over exuberant propensity to spend.
The idea of new underground heavy rail lines to connect with the commuter rail system of southeast Queensland isn’t new. I can recall some 15 years ago proposing just that in a policy paper for the Property Council. The paper identified new stations in the CBD as a critical element in making use of rail transit more user friendly. The existing downtown stations, we argued, were barely downtown anymore, because the modern downtown (of close to 2 million square metres of office space, major retail, and entertainment hubs) had shifted toward the river and away from the stations.
This large concentration of office workers should prove prime candidates for public transit, since they typically work regular hours (which helps with service schedules) and are concentrated at the centre of a hub and spoke system. But the walk from their workplace to the nearest stations, in summer heat or rain, represents (among other things) a disincentive to rail transit. So logically a new underground station (or even two) which brings the convenience of commuter rail closer to the workplace should encourage more people to make use public transport. Clearly, if you owned office buildings anywhere along the river edge of the ‘Golden Triangle’, you’d welcome this initiative with open arms and beg the Government to fast track the proposal.
So it could indeed be a great idea. But first there are few unanswered questions about the economics of heavy rail commuter transport. The latest State Government figures show that every trip, by each and every commuter on the City Train network, is now subsidized to the tune of $10. That’s per trip, so for every daily return trip, the taxpayer is forking over $20 per commuter. And that’s after commuters have paid their fare – remember it’s only the subsidy. Even worse, the numbers of patrons are falling, from 60.7 million to 57 million in a year. (Worth reading the article “Taxpayers’ share of rail fares increases, while CityTrain passengers continue to decline” in The Courier Mail, June 15, 2010).
The concern here is that under this failed pricing model, more commuters may also mean more subsidies and a greater tax burden on the taxpayer. In short, there doesn’t seem to be an economy of scale: if more people caught the train under the present system, it could cost more in subsidies, not less.
Ironically, an online poll taken in connection with the above story revealed that 79% of respondents (out of 824) claimed that train fares are already too high. This is especially ironic for two reasons: commuters with jobs in the CBD market are, on average, paid more than their suburban counterparts and commuters who use the rail service are increasingly drawn from more affluent inner city and middle ring suburbs. The proportion of public transport users who begin their journey in lower income, outer suburbs, is relatively small.
The evidence for this is found in papers by people such as Dr Paul Rees, School of Global Studies, Social Science & Planning at RMIT, and others. Various studies increasingly point to a rising correlation between rail (and tram in the case of Melbourne) use and proximity to central city workplaces. Put crudely, big chunks of that $10 each way subsidy are being paid for by low and middle income taxpayers in the outer suburbs (far from convenient train stations) so higher paid central city workers can have access to a convenient form of transport from their inner city or middle ring home, to work.
As for the mooted new underground rail network, according to the Queensland Premier Anna Bligh, the network will service “Toowong, West End, the city, Newstead, Bowen Hills, Bulimba and Hamilton North Shore.” In Brisbane’s case, these are inner city areas which enjoy some of the highest real estate prices in the region. In short, this is where the rich people live and will also be subsidized.A further question needs to be raised about the potential growth in commuter rail traffic, notwithstanding the convenience of a new CBD station. With the exception of the new line to Springfield, there are no new lines being laid and no new stations proposed. The catchment populations around the various train stations that form the City Train network are variously touted as ‘TOD’ (transit oriented development) zones but … there’s been precious little development activity to show for a decade of discussion.
In the end, simply building more housing around train stations won’t mean more commuters to the CBD because most of the jobs are in the suburbs in the first place, and getting more so. I am unaware of any State Planning Policy which aims to concentrate more office and retail workers in the CBD (indeed the pressure is on to decentralize). And without more workers in the CBD, there are simply not going to be more commuters wanting to go there. So you can have more housing around train stations but this won’t mean more people working in the city – unless there’s also going to be more jobs in the city (or the mode share rises).
An additional brake on increasing patronage of the heavy rail network is the inability to get to a suburban train station in order to easily catch the train. If you live more than a kilometre from a train station (the overwhelmingly majority of all residents), you would need to drive your car to a station to ride. But stations have precious little in the way of parking for these commuters, and nearby residents justifiably object to having their streets turned into kerbside carparks for daily rail commuters. This is one of many practical realities holding back increases in mode share of rail as a percentage of all commuter trips. That proportion has remained stubbornly fixed at under 10% of all trips for Brisbane (rail and bus and ferry combined) while for the CBD the mode share sits at some 45% of all commuter trips (bus, rail and ferry combined).
So while the notion of a new underground rail line with a new CBD station sounds like a terrific idea, you’d hope that those who are responsible for spending our money will be running some hard numbers on the feasibility. This cross river rail project is mooted to cost something like $8.2 billion dollars in today’s terms. By the time they get around to building it, it will no doubt cost more.
Even if the cross river rail and new station managed to achieve the result of 100,000 new rail commuters, that still works out to $82,000 per extra commuter. And if those commuters are to continue to be further subsidised to the tune of $10 per trip, each way, every day, this could be the sort of infrastructure initiative which ends up costing the community a great deal.
You’d hope the numbers are being compiled rationally, dispassionately and independently, and the proper questions asked. Quality, strategic infrastructure investment in our urban areas is an economic necessity. But irrationally conceived projects of dubious economic merit are not the way forward.
Ross Elliott is a 20 year veteran of property and real estate in Australia, and has held leading roles with national advocacy organizations. He was written and spoken extensively on housing and urban growth issues in Australia and maintains a blog devoted to public policy discussion: The Pulse.
Photo by monkeyc.net
-
Driving and Transit in America: Myths from Down Under
I nearly fell off my bicycle when I read that driving had declined 43% in the United States and transit use had increased 65%. Australia’s The Fifth Estate attributes these figures to Professor Peter Newman of Sydney’s Curtin University at an event at the Hassell architectural and urban planning firm offices in Sydney. In speaking about a declining driving trend in Australia, The Fifth Estate reports Professor Newman as saying that:*
“… new research from the United States shows this is not a localised trend – car use in the US has plunged 43 percent and there has been a 65 percent leap in public transport use.”
As anyone remotely familiar with US transport trends knows, the statement is erroneous. The driving claim is more than 20 times (2,000%) the reality, while transit has seen no ridership increase remotely approaching 65% since World War II, when gasoline (petrol) and tires were rationed.
Professor Newman is one of the world’s leading advocates of compact city policies (urban consolidation or smart growth policies), and was co-author of Cities and Automobile Dependence (with Professor Jeffrey R. Kenworthy). This 1990 volume broke new ground in reporting international transport data (one can take issue with commentary in the book, but the data is solid as have been subsequent revisions under Professor Kenworthy’s leadership). Professor Newman has also served as Sustainability Commissioner for the state of New South Wales (Sydney is the capital) and serves on the federal government’s Infrastructure Advisory Council.
In view of Professor Newman’s prominence, Australian colleagues asked me for clarification on the matter. I contacted Tina Perinotti, author of the story (by whom I had been interviewed while on a national speaking tour of Australia in 2006). She indicated concern said she would investigate it and make any necessary correction. The last I heard, she had been referred to a Brookings Institution publication. I responded that nothing would be found at Brookings to support the absurd notion that driving is down 43% and transit is up 65% (since we all rely on the same authoritative data sources). Approaching one month after publication (July 24), the error has neither been retracted nor clarified.
The actual data shows the following:
Driving Trends in the United States: According to the Federal Highway Administration of the United States Department of Transportation, driving is down from its 2007 historic peak. The price of gasoline rose 90% from early 2007 to middle 2008, which combined with the worst economic downturn since the Great Depression (See Note), resulted in a 1.9% decline from 2007 to 2008. By comparison, the largest previous post-war decline in driving was 1.4% during the 1973-1974 energy crisis. The first five months of 2010 indicate a 1.7% reduction in driving from 2007, however driving has been up each of the last three months. The decline in urban areas (where transit operates) is smaller, at 1.1%. Either figure is a far cry from 42%.
Transit Trends in the United States: Transit ridership increased, especially as gasoline prices rose. While skyrocketing gasoline prices produced a modest decline in driving from 2007 to 2008, transit ridership increased more than 5%. In context, however, the ridership increases were inconsequential (Figure), because transit accounts for such a small share of urban travel (under 2%). During the gasoline price spike, only 10% of the loss in urban highway passenger miles was transferred to transit. It seems likely that people just traveled less or combined trips. More recently, transit ridership has begun declining. Data from the American Public Transportation Association indicates that transit ridership (first quarter annualized) has declined 6% from its 2008 peak. Over the same period, urban driving declined by less than one-tenth of the transit rate, at 0.4%.
Trends in Australia: As in the United States, modest driving declines occurred in Australia. According to data from the Bureau of Infrastructure, Transport and Regional Economics, driving declined 0.04% in the five largest capital cities (Sydney, Melbourne, Brisbane, Perth and Adelaide), as gasoline prices increased (from the peak in 2007 to 2008). Over the same time period, transit ridership was up 6%. A more recent annual report by the New South Wales Department of Transport indicated that driving had dropped 1%. However, the three year period covered (July 2006 to June 2009) included the gasoline price spike, which was an important factor in reducing driving. The same report found that automobile ownership in Sydney had increased over the same period, which would seem to evidence the lack of any cultural shift (though cultural shifts are not indicated by miniscule numbers).
It is not surprising that neither Australians nor Americans have seen their streets and highways freed from congested traffic. Indeed, in Sydney one way work trips take just as long as before (34 minutes) and longer than any US metropolitan area except New York.
* Subsequently corrected by The Fifth Estate
—–
Note: For a description of the connection between compact city policies (smart growth), US housing bubble, and subsequent international financial crises, see Root Causes of the Financial Crisis: A Primer.
—–
Photograph: Freeway and transit in Perth, Western Australia (by the author)
Wendell Cox is a Visiting Professor, Conservatoire National des Arts et Metiers, Paris. He was born in Los Angeles and was appointed to three terms on the Los Angeles County Transportation Commission by Mayor Tom Bradley. He is the author of “War on the Dream: How Anti-Sprawl Policy Threatens the Quality of Life.
”
-
CA State Treasurer Skeptical of High-Speed Rail
California High Speed Rail officials and the Governor’s office seem to be suffering from selective hearing. Lawmakers and experts at the University of California’s Institute of Transportation continue to challenge the high-speed rail project’s viability due to precarious statistical projections on ridership and cost. One wonders if developers will reconsider upon hearing California treasurer Bill Lockyer’s recent criticisms.
Lockyer’s first major issue lies with the basics: the ability to raise enough capital from private sources needed to complete the project. The Rail Authority claims it would need $10 to $12 billion from private investment alone, although some analysts think that, like most of the monetary figures associated with the rail line, this number will ultimately grow. Investors are reluctant to fund such a risky venture, as nothing proposed in this project has proven stable or certain. If investors do indeed close their checkbooks, there is no way the Rail Authority will complete the project.
Lockyer doesn’t think selling the idea in smaller chunks would work either. He questions the willingness of anyone to buy state bonds for the HSR, even though voters approved $9.95 billion worth in November 2008.
Despite these reservations, Governor Schwarzenegger is protecting the funding promises made in the 2008 ballot measure. The Rail Authority is also ignoring the warnings of Lockyer and others. They are also trying to start building in the Bay Area in order to meet deadlines for federal funding. But the way things are going, it looks as if federal funding is all they will get. As more and more powerful people add their names to the list of skeptics, the high-speed rail line seems that much closer to complete failure.
Rather than overriding their critics and spending money they may not get, the Rail Authority should invest in consumer confidence. They need more concrete plans and more promising statistics to create a market for this line because right now, most think the project will turn out to be nothing more than a huge budgetary debacle.
-
60% of GDP Too Much for High Speed Rail: Vietnam National Assembly
In a surprise move, the Vietnam National Assembly rejected plans proposed by the government to built a high speed rail line from Ho Chi Minh (Saigon) to Hanoi.
Some opponents expressed concern that the line would not be competitive with air service. The 900 mile route, which was to operate at up to 186 miles per hour, would take between five and six hours to make the trip between Vietnam’s two principal cities. This compares to the current two hour trip by air. Concerns were expressed that this travel time, combined with fares that would need to be competitive with those of airlines would be insufficient to make the line a viable economically.
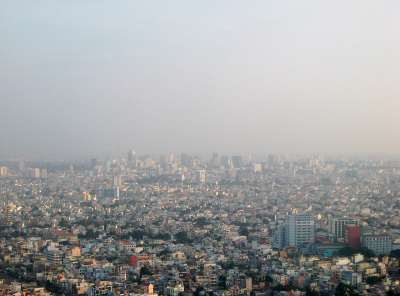 But the strongest objections were expressed with respect to the context of such a large expenditure in a developing nation. The high speed rail line would have cost an amount equal to 60% of Vietnam’s gross domestic product, even before the cost overruns that have typically plagued such projects. This is akin to spending $8.5 trillion on high speed rail in the United States (more than $25,000 per capita).
National Assembly member Nguyen Minh Thuyet told the Agence France-Press that some children in the Central Highlands can only get to school by swinging on a cable across a river because they have no bridge, questioning the validity of such an expensive project in light of the nation’s low income.
Photograph: Ho Chi Minh (Saigon)
-
Beijing on Track to Be World’s Busiest Airport
For years, the world’s busiest airports in passenger volume have been Atlanta’s Hartfield-Jackson International and Chicago’s O’Hare. However, there are indications that this long dominance may be about to end. According to Airport Council International data for 2009, Chicago O’Hare had fallen to 4th position, following Atlanta, London-Heathrow and Beijing Capital International Airport.
Beijing’s Capital International increased its passenger volume by 17% in 2009, while European and American airports were experiencing slight declines due to the recession. Beijing’s increase is more significant, because growth might have been expected to level off after the 2008 Olympics, which were held in Beijing. Between 2008 and 2009, Beijing rose from 8th in the world to 3rd, and from 20th place in 2004, when its volumes were approximately one-half the present level.
Early 2010 data (first quarter) indicates that Beijing Capital International has become the second busiest airport in the world, trailing only Atlanta. Passenger volumes were up 10.5% from a year earlier. If the current rate of growth continues, Beijing should pass Atlanta in two to three years, even if the American economy improves.
London’s 130 million annual passenger traffic was the greatest of any metropolitan area in the world in 2009 (distributed among five airports). The new Conservative-Liberal Democrat government seems determined, however, to forfeit this ranking, having banned further London airport expansions to combat what it calls “binge flying.”
New York was second with passenger traffic of 105 million at its three major airports, while Tokyo was third at 95 million. “Binge flying” does not seem to be a concern in Japan, where Tokyo’s Haneda Airport is adding a fourth runway and will soon serve international flights again, providing competition to more distant Narita. Atlanta’s single airport handles an annual passenger volume of 88 million.
Other airports in China are also growing. In the Pearl River Delta (the world’s largest “mega-region,” an area of adjacent urban areas), the four large airports, Hong Kong, Guangzhou and Shenzhen accommodated passenger traffic of more than 105 million in 2009. Traffic at Shanghai’s Pudong and Hongqiao grew 14% and 10% respectively.
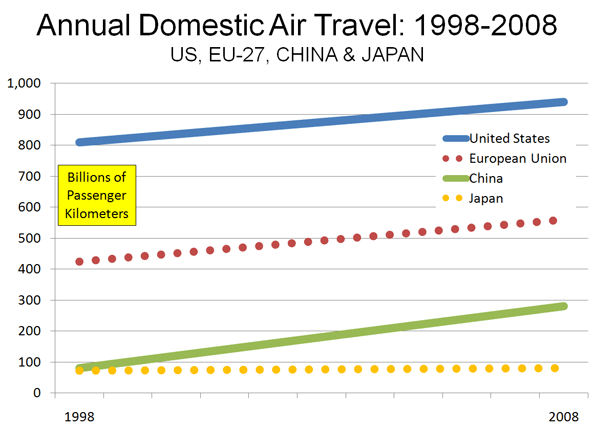
Overall Chinese air traffic is also growing rapidly. Over the past 10 years, annual passenger volumes have risen an average of more than 25%. This compares to an average annual growth rate of 3.2% in the European Union (EU-27), 1.6% in the United States and 1.1% in Japan (Figure). The US continues to be dominant in passenger volumes, at 940 billion annual passenger kilometers, compared to 560 billion in the European Union, 280 billion in China and 80 billion in Japan (data calculated from US, Europe, China and Japan national sources).
-
The Need to Expand Personal Mobility
Few books in recent memory have started from as optimistic or solid a foundation as Reinventing the Automobile: Personal Urban Mobility for the 21st Century. Reinventing the Automobile conveys a strong message that improved personal mobility is necessary and desirable:
“Have we reached the point where we now must seriously consider trading off the personal mobility and economic prosperity enabled by automobile transportation to mitigate its negative side effects? Or, can we take advantage of converging 21st century technologies and fresh design approaches to diminish those side effects sufficiently while preserving and enhancing our freedom to move about and interact? This book concludes the latter.”
The authors include William J. Mitchell, Professor of Architecture, and Media Arts and Sciences at the Massachusetts Institute of Technology directs the Smart Cities research group at the MIT Media Lab, Christopher Boroni-Bird, Director of Advance technology Vehicle Concepts at General Motors and Lawrence D. Burns, who consults on transportation, energy and communications systems and technology. The book is published by the MIT Press.
Getting Urban Economics Right
The authors start with getting the urban economics right. They recognize that the “freedom and prosperity benefits” of the automobile “have been substantial.” They note that the automobile industry “set the stage for the growth of the middle class,” something that has been labeled the “democratization of prosperity.” The authors say that the car “enabled modern suburbia” and “powered a century of economic prosperity.” This refreshing treatment is consistent with the overwhelming economic evidence that links personal mobility with prosperity, such as by Remy Prud’homme and Chang-Wong Lee, David Hartgen and M. Gregory Fields and others. It is also at considerable odds with the widely accepted, somewhat nostalgic planning orthodoxy that rejects private automotive transport as “unsustainable”, unaesthetic and anti-social. This ideology embraces the illusion that forcing people to travel longer, with less personal flexibility somehow will improve the economy and raise the standard of living.
The Future of the Automobile?
The authors envision a automobile characterized by a new “DNA.” It starts with smaller cars, fueled by electricity and hydrogen (fuel cell technology). It also begins with an understanding that the cars used in many mundane urban operations today – for example getting to the market or pick up the kids at school – are over-engineered. They are far larger than is needed for most trips, their capacity for speed exceeds urban requirements and their range between refueling is also more than needed.
The authors would re-engineer urban vehicle to the needs of metropolitan dwellers, an “ultra-small vehicle” (USV). The designs proposed include far lighter cars that can be easily “folded” up to minimize parking space requirements. Cars would be connected to one another by wireless technology, all but eliminating the possibility of collisions. The cars would be small enough that they could be assigned special dedicated lanes on current freeways and streets. Travel would be less congested because the dedicated lanes would have a far higher vehicle capacity, while the interconnectedness would allow cars to safely operate closer to one another.
The combination of electricity, hydrogen, wireless technology and the USV would bring additional benefits. This would permit improved vehicle routing, as drivers would be advised take alternate less congested routes. This would also, in time, lead to self-drive cars, about which Randal O’Toole has recently written, made possible by the use of wireless technology and that dedicated lanes would make possible.
Empowering Transit Riders through Car Sharing
Car sharing is an important part of this future, for dwellers of dense urban cores, according to Reinventing the Automobile. The author’s note that car sharing can solve the “first mile-last mile” problem making it possible for transit users to speed up their trips by not having to walk long distances to and from transit stops. Indeed, car sharing programs are set to be adopted in urban cores with some of the world’s best transit systems, such as Paris, and London. Privately operated car sharing systems have been established in a number of US metropolitan areas, such as Atlanta, Denver and San Francisco.
Progress with Conventional Strategies
The longer term vision of the MIT Press authors may take a while to unfold, but we can already see potential for progress. Just this week, “super-car” developer Gordon Murray announced development of an urban car (the T25), smaller than the “Smart,” which would achieve nearly 60 miles per gallon, with plans for marketing within two years. Volkswagen has developed a “1-litre” car, which would achieve 235 miles per gallon on diesel fuel. All of this makes the 51 mile per gallon Toyota Prius seem gluttonous by comparison
These developments and the Reinventing the Automobile vision show that it is unnecessary to tell people in America (or Europe or the developiung world) that they must give up their automobiles. That is good news. The social engineering approaches requiring people to move from the suburbs to dense urban cores and travel by slower, less frequent transit are incapable of achieving serious environmental gains (see below) and can not seriously be considered progress or desirable by most people in advanced countries.
The Superiority of Technology
This is illustrated by recent developments in automobile technology and research (Figure).
- Before the adoption of the new 2020 and 2016 new car fuel economy standards, the US light vehicle fleet was on track to increase its greenhouse gas (GHG) emissions nearly 50% from 2005 to 2030 (the green dotted line in the figure).
- As a result of the new fuel economy standards, Department of Energy projections indicate that greenhouse gas emissions from light vehicles will be one-third less by 2030 compared to the 2005 fleet (the yellow dotted line), and this is at the standard projected driving increase rates that could well be high.
- The smart growth strategies of land rationing, densification and discouraging driving would produce, at best, a marginal reduction in GHG emissions, using the mid-point of the recent proponent research (Moving Cooler), indicated by the solid blue line. Actually, this overstates the impact of smart growth, since it discounts the substantial GHG emissions gains that result from higher fuel consumption in more congested traffic produced by densification.
- The potential for technological advance is illustrated by the green solid line, which estimates the GHG emissions from light vehicles in 2030 if the average fuel economy were equal to today’s best hybrid technology.
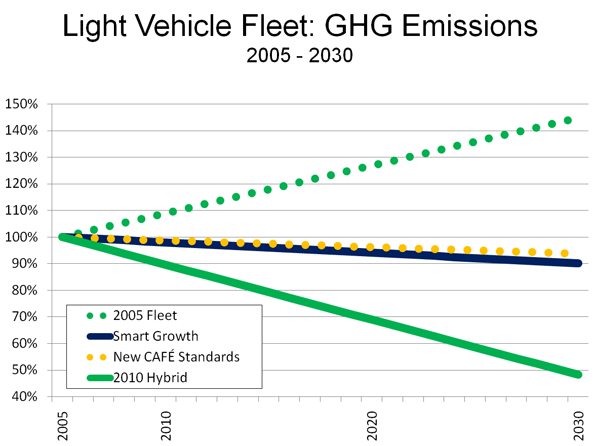
Overall auto-centered technology-based strategies – such as the improved fuel economy standards and the hybrid fuel economy – would each produce about 15 times as much benefit as the smart growth strategies proposed by such studies as Moving Cooler. This approach would not only be far more productive in terms of environmental improvement but would not require interfering with people’s lives in ways that would require longer trips times, less convenience, seriously retarded job access and, inevitably, fewer jobs and lower levels of economic growth.
Technology: The Only Way
It would be a mistake – and likely political folly – to force a re-engineering our way of life in order to enact strategies with dubious environmental benefits. In the final analysis, personal mobility must be retained and expanded, because there is no alternative that is acceptable to people, whatever system of government they happen to live under. Reinventing the Automobile paints the most optimistic picture to date and, if given due serious treatment, could prove a debate changer.
Photograph: Manila suburbs
Wendell Cox is a Visiting Professor, Conservatoire National des Arts et Metiers, Paris. He was born in Los Angeles and was appointed to three terms on the Los Angeles County Transportation Commission by Mayor Tom Bradley. He is the author of “War on the Dream: How Anti-Sprawl Policy Threatens the Quality of Life.
-
Kudos to Houston Traffic from IBM
IBM has released its annual “Commuter Pain Index,” which ranks traffic congestion in 20 metropolitan areas around the world. According to IBM, the Commuter Pain Index includes 10 issues: “1) commuting time, 2) time stuck in traffic, agreement that: 3) price of gas is already too high, 4) traffic has gotten worse, 5) start-stop traffic is a problem, 6) driving causes stress, 7) driving causes anger, 8) traffic affects work, 9) traffic so bad driving stopped, and 10) decided not to make trip due to traffic.”
Each metropolitan area is given a score between 0 and 100, with the highest score indicating the worst traffic congestion (See Table).
IBM Commuter Pain Index: 2010 Metropolitan Areas Ranked by Worst Traffic Congestion Rank Metropolitan Area Score (Worst to Best) 1 Beijing 99 1 Mexico City 99 3 Johannesburg 97 4 Moscow 84 5 Delhi 81 6 Sao Paulo 75 7 Milan 52 8 Buenos Aires 50 9 Madrid 48 10 London 36 10 Paris 36 12 Toronto 32 13 Amsterdam 25 13 Los Angeles 25 15 Berlin 24 16 Montreal 23 17 New York 19 18 Melbourne 17 18 Houston 17 20 Stockholm 15 Favorable Urban Planning Characteristics Associated with Intense Traffic Congestion: The worst traffic congestion was recorded in the developing world metropolitan areas of Beijing, Mexico City, Johannesburg, Moscow, Delhi and Sao Paulo. In many ways, these metropolitan areas exhibit characteristics most admired by current urban planning principles. Automobile ownership and per capita driving is low. Transit carries at least 40% of all travel in each of the metropolitan areas. Yet traffic is intense. This is due to another urban planning “success,” objective, high population densities. Higher population densities are inevitably associated with greater traffic congestion (and more intense local air pollution), whether in the United States or internationally. All six of these metropolitan areas scored 75 or above, where a score of 100 would be the worst possible congestion.
The next five metropolitan areas have accomplished nearly as much from an urban planning perspective. Milan, Buenos Aires, Madrid, London and Paris all achieve more than 20% transit market shares, and their higher urban densities also lead to greater traffic congestion. Each scores between 35 and 52.
Traffic congestion is less in the next group, which includes Toronto, Los Angeles, Berlin, Amsterdam and Montreal. With the exception of Berlin, transit market shares are less, though the urban densities in all are above average US, Canadian and Australian levels. Amsterdam, the smallest metropolitan area among the 20, scores surprisingly poorly, since smaller urban areas are generally associated with lower levels of traffic congestion.
The Least Congested Metropolitan Areas: Four metropolitan areas scored under 20, achieving the most favorable traffic congestion ratings. New York scores 19, with its somewhat lower density (the New York urban density is less than that of San Jose). Even lower density Melbourne and Houston score 17, tying for the second best traffic conditions. Stockholm achieves the best traffic congestion score, at 15, despite its comparatively high density. Stockholm is probably aided by its modest size which is similar to that of Orlando (Florida).
The Houston Advantage: Perhaps the biggest surprise is Houston’s favorable traffic congestion ranking.
- Houston has the lowest urban density of the 20 metropolitan areas.
- Houston has the lowest transit market share, by far, at only 1%.
- Houston also has the highest per capita automobile use among the IBM metropolitan areas.
 Yet Houston scored better than any metropolitan area on the list except for much smaller Stockholm. As late as 1985, Houston had the worst traffic congestion in the United States, according to the annual rankings of the Texas Transportation Institute. Public officials, perhaps none more than Texas Highway Commission Chair and later Mayor Bob Lanier led efforts to improve Houston’s road capacity, despite explosive population growth. Their initiatives paid off. By 1998, Houston had improved to 16th in traffic congestion in the United States. The population growth has been incessant, so much so that Houston has added more new residents since 1985 than live in Stockholm and more than half as many as live in Melbourne. While Houston had slipped to 11th in traffic congestion by 2007, the recent opening of a widened Katy Freeway and other improvements should keep the traffic moving in Houston better than in virtually all of the world’s other large metropolitan areas.
Photo: Freeway in Houston