Tag: Transportation

  • University of California Report Calls Cambridge Systematics High-Speed Rail Ridership Forecast Unreliable

    A just-released report by the Institute of Transportation Studies at the University of California-Berkeley finds that the ridership projections prepared by Cambridge Systematics (CS) for the California high speed rail system are “not reliable.”

    Authors Samer Madanat (director of ITS-Berkeley and a professor of civil and environmental engineering), Mark Hanson (UC-Berkeley professor of civil and environmental engineering) and David Brownstown (chair of the Economics Department at UC-Irvine) essentially reported that the projections had such large error margins that the system could either lose a lot of money or make a lot of money:

    … the combination of problems in the development phase and subsequent changes made to model parameters in the validation phase implies that the forecasts of high speed rail demand-and hence of the profitability of the proposed high speed rail system-have very large error bounds. These bounds, which were not quantified by CS, may be large enough to include the possibility that the California HSR may achieve healthy profits and the possibility that it may incur significant revenue shortfalls.

    Biased High Speed Rail Projections: Given the overwhelming history of upwardly biased ridership and revenue projections in major transport projects, it seems far more likely that reducing the margins of error would produce projections with much smaller ridership numbers and major financial losses. Major research by Oxford University professor Bent Flyvbjerg, Nils Bruzelius (a Swedish transport consultant) and Werner Rottenberg (University of Karlsruhe and former president of the World Conference on Transport Research) covering 80 years of infrastructure projects found routine over-estimation of ridership and revenue (Megaprojects and Risk: An Anatomy of Ambition). The evidence is so condemning that Dr. Flyvbjerg has referred to the planning processes for such projects as consisting of “strategic misrepresentation” and “lying” (his words) to advance projects that might not otherwise be implemented.

    Broad Concern about the Reliability of California High Speed Rail Projections: The University of California report joins other reports that have questioning the veracity of the Cambridge Systematics projections. During the run-up to the 2008 statewide bond issue, the California Senate Transportation and Housing Committee, chaired by Senator Alan Lowenthal (D-Long Beach) indicated concerns. Illustrating continuing concerns, the committee commissioned the University of California study.

    Doubts have been expressed by the California Legislative Analyst and the California State Auditor. The Reason Foundation Due Diligence Report, authored by Joseph Vranich and me in 2008 estimated the ridership projections to be at least 100% high (see High Speed Rail: Untimely Extravagance presented at the Heritage Foundation last week in Washington).

    Investment Grade Projections Far Lower: The Cambridge Systematics ridership projections publicized that were used in the statewide bond election were more than 150% above the “investment grade” projections that had been produced by Charles Rivers Associates for the California High Speed Rail Authority a decade ago. Even “investment grade” projections can be high, as the recent bond default and bankruptcy of the Las Vegas Monorail indicates. In that case the “investment grade” ridership projections were 150% above the actual achieved average, nonetheless bond holders lost their investments. (Our 2000 report accurately projected the Monorail ridership).

    Undermining GHG Emissions Reduction Claims: Meanwhile, the California high speed rail proposal has come under criticism with respect to its environmental claims. The high speed rail line has been promoted as a means for reducing greenhouse gas (GHG) emissions in the state. Yet another recently released University of California report indicates that it could take as long as 71 years to save enough GHG emissions by attracting airline passengers and drivers to cancel out the emissions produced in constructing the project. More defensible ridership projections could lengthen this period considerably.

    Response to Criticism: The body of the University of California high speed rail study is 10 pages, followed by approximately 40 pages of comments and response by Cambridge Systematics and a letter from the California High Speed Rail Authority requesting that the University of California authors to consider the comments. This review is performed by the University of California authors, as they reject virtually all Cambridge Systematics criticisms in the final four pages of the report.

    Photograph: Cover of Megaprojects and Risk: An Anatomy of Ambition

  • Despite Transit’s 2008 Peak, Longer Term Market Trend is Down: A 25 Year Report on Transit Ridership

    In 2008, US transit posted its highest ridership since 1950, a development widely noted and celebrated in the media. Ridership had been increasing for about a decade, however, 2008 coincided with the highest gasoline prices in history, which gave transit a boost.

    Less reported was the fact that despite higher ridership, transit’s market share (of transit and motor vehicles) has fallen since the 1950s. In 1955, transit’s market share was over 10%. By 2005, transit’s share had dropped to 1.5%, but recovered only to 1.6% in 2008. Transit’s all time peak ridership was in 1945, driven up by World War II and gas rationing. It is thus not surprising that national transit ridership (boardings) declined 3.8% in 2009 as gasoline prices moderated.

    Market Share by Major Urban Area

    Demographia has released urban area roadway and transit market share estimates for 2008, based upon Federal Transit Administration and Federal Highway Administration data. The table below compares 2008 with 1983 market share data for 56 urban areas with a corresponding metropolitan area population of more than 900,000 (complete data).

    Urban Areas: Roadway & Transit Market Share: 2008
    Ranked by 2008 Transit Market Share
    With 25 Year (1983) Comparison
        2008 1983 Roadway Share % Change
    Rank Urban Area Roadway Share Transit Share:  Roadway Share Transit Share: 
    1 New York 89.0% 11.0% 87.7% 12.3% 1.5%
    2 San Francisco 95.0% 5.0% 93.7% 6.3% 1.4%
    3 Washington 95.5% 4.5% 96.1% 3.9% -0.6%
    4 Chicago 96.1% 3.9% 94.2% 5.8% 2.0%
    5 Honolulu 96.2% 3.8% 93.2% 6.8% 3.2%
    6 Boston 96.7% 3.3% 97.5% 2.5% -0.8%
    7 Seattle 97.2% 2.8% 97.6% 2.4% -0.4%
    8 Philadelphia 97.3% 2.7% 96.0% 4.0% 1.4%
    9 Portland 97.7% 2.3% 97.6% 2.4% 0.1%
    10 Salt Lake City 97.8% 2.2% 99.1% 0.9% -1.3%
    11 Los Angeles 98.1% 1.9% 98.1% 1.9% 0.0%
    12 Denver 98.2% 1.8% 98.5% 1.5% -0.3%
    13 Baltimore 98.3% 1.7% 97.7% 2.3% 0.6%
    14 Pittsburgh 98.6% 1.4% 97.3% 2.7% 1.3%
    15 Miami-West Palm Beach 98.7% 1.3% 98.8% 1.2% -0.1%
    16 Atlanta 98.8% 1.2% 98.0% 2.0% 0.8%
    16 Cleveland 98.8% 1.2% 98.0% 2.0% 0.8%
    16 Las Vegas 98.8% 1.2% 99.6% 0.4% -0.8%
    16 Minneapolis-St. Paul 98.8% 1.2% 98.8% 1.2% 0.0%
    16 San Diego 98.8% 1.2% 99.3% 0.7% -0.5%
    21 San Jose 99.0% 1.0% 99.0% 1.0% 0.0%
    22 Austin 99.1% 0.9% 99.7% 0.3% -0.6%
    22 Houston 99.1% 0.9% 99.0% 1.0% 0.1%
    22 Milwaukee 99.1% 0.9% 98.3% 1.7% 0.8%
    22 Sacramento 99.1% 0.9% 99.0% 1.0% 0.1%
    22 San Antonio 99.1% 0.9% 98.7% 1.3% 0.4%
    27 St. Louis 99.2% 0.8% 99.0% 1.0% 0.2%
    28 Buffalo 99.3% 0.7% 98.5% 1.5% 0.8%
    28 Providence 99.3% 0.7% 98.9% 1.1% 0.4%
    30 Charlotte 99.4% 0.6% 99.3% 0.7% 0.1%
    30 Cincinnati 99.4% 0.6% 98.7% 1.3% 0.7%
    30 Dallas-Fort Worth 99.4% 0.6% 99.4% 0.6% 0.0%
    30 Hartford 99.4% 0.6% 98.7% 1.3% 0.7%
    30 Orlando 99.4% 0.6% 99.7% 0.3% -0.3%
    30 Phoenix 99.4% 0.6% 99.4% 0.6% 0.0%
    30 Rochester 99.4% 0.6% 98.9% 1.1% 0.5%
    30 Tucson 99.4% 0.6% 98.9% 1.1% 0.5%
    38 Detroit 99.5% 0.5% 98.8% 1.2% 0.7%
    38 Fresno 99.5% 0.5% 99.3% 0.7% 0.2%
    38 New Orleans 99.5% 0.5% 97.4% 2.6% 2.2%
    38 Norfolk-Virginia Beach 99.5% 0.5% 99.2% 0.8% 0.3%
    38 Riverside-San Bernardino 99.5% 0.5% 99.6% 0.4% -0.1%
    43 Columbus 99.6% 0.4% 98.6% 1.4% 1.0%
    43 Louisville 99.6% 0.4% 98.9% 1.1% 0.7%
    43 Memphis 99.6% 0.4% 99.4% 0.6% 0.2%
    43 Tampa-St. Petersburg 99.6% 0.4% 99.5% 0.5% 0.1%
    47 Bridgeport 99.7% 0.3% 99.8% 0.2% -0.1%
    47 Jacksonville 99.7% 0.3% 99.4% 0.6% 0.3%
    47 Kansas City 99.7% 0.3% 99.4% 0.6% 0.3%
    47 Nashville 99.7% 0.3% 99.4% 0.6% 0.3%
    47 Raleigh 99.7% 0.3% 99.9% 0.1% -0.2%
    47 Richmond 99.7% 0.3% 99.1% 0.9% 0.6%
    53 Indianapolis 99.8% 0.2% 99.3% 0.7% 0.5%
    54 Birmingham 99.9% 0.1% 99.5% 0.5% 0.4%
    54 Oklahoma City 99.9% 0.1% 99.9% 0.1% 0.0%
    54 Tulsa 99.9% 0.1% 99.6% 0.4% 0.3%
    Unweighted Average 98.7% 1.3% 98.3% 1.7% 0.4%
    All Urban Areas Combined 98.4% 1.6% 97.5% 2.5% 0.9%
    Based upon passenger miles
    Core urban areas in metropolitan areas with more than 900,000 population in 2009.
    Derived from Federal Transit Administration and Federal Highway Administration data
    Los Angeles and Mission Viejo urban areas combined
    San Francisco, Concord and Livermore urban areas combined
    Historic transit market share data at http://www.publicpurpose.com/ut-usptshare45.pdf
    Maryland commuter rail (MARC) assigned to Washington, DC

    In 1983, transit systems started receiving support from federal taxes on gasoline. This was also the first year that the National Transit Database reported on the same annual basis as it does today. One justification for using funds from road users was the hope of attracting people from cars to transit. The national data above and the urban area below show that the overwhelming share of new travel has, nonetheless, continued to be captured by motor vehicles rather than transit. Among the 56 urban areas, 13 experienced gains in transit market share from 1983 to the peak year of 2008, while 37 posted losses and six had no change. Transit was able to capture only 0.9% of new urban travel between 1983 and 2008, while roadways captured 99.1%. (Note 1).

    The Top 10: Still a New York Story

    #1: New York: The nation’s predominant urban area remains New York, with an 11.0% transit market share. In 2008, 41% of the national transit ridership (passenger miles) was in New York, with much of it either in or focused upon New York City. The New York City Transit Authority, and a host of local public and private systems, principally serve New York City destinations and account for a remarkable 38% of the nation’s transit ridership. Even so, transit’s market share dropped from 12.3% in 1983. As a result, the roadway market share in New York increased 1.5% between 1983 and 2008, the fourth largest gain in the nation. Transit attracted 8.7% of the new demand between 1983 and 2008, while roadways attracted 91.3%.

    #2: San Francisco: San Francisco had the nation’s second highest transit market share in 2008, at 5.0%. This is a decline from 6.3% in 1983. Nonetheless, San Francisco moved up from 6th place in 1983. This produced a 1.4% increase in the roadway market share between 1983 and 2008, the fifth largest gain in the nation. Transit accounted for 2.2% of the new demand, while roadways attracted 97.8%.

    #3: Washington: Washington placed third in transit market share in 2008, at 4.5%. This represents a gain from 3.9% in 1983 and an improvement from 6th place. Washington was the only urban area among the top five to experience an increase in transit market share. Much of Washington’s transit increase was on its expanding Metrorail system and the MARC commuter rail system (most of the ridership on this Maryland based system commutes to Washington. Overall, transit in Washington has attracted 5.1% of new travel over the past 25 years, while roadways attracted 94.9% of new demand.

    #4: Chicago: Chicago ranked fourth in transit market share, at 3.9%. In 1983, Chicago had ranked 3rd, with a market share of 5.8. The roadway market share in Chicago increased 2.0% from 1983 to 2008, the third largest road travel gain in the nation. Transit attracted 1.3% of new demand over the period in Chicago, while roadways attracted 98.7%.

    #5: Honolulu: Honolulu ranked fifth in transit market share, at 3.8%. This is a significant drop from 1983, when Honolulu ranked 2nd in the nation, with a transit market share of 6.8%. Honolulu’s roadway market share gain was the largest in the nation between 1983 and 2005, at 3.8%. Transit ridership also dropped in Honolulu from 1983 to 2008, so that roadways accounted for all new travel.

    #6: Boston: Boston ranked sixth in transit market share in 2008, at 3.3%. This is a gain from 2.5% in 1983, when Boston ranked 9th. Much of Boston’s increase is attributable to its commuter rail expansion. Transit captured 4.1% of new demand, while roadways attracted 95.9%.

    #7: Seattle: Seattle’s principally all bus transit system ranked 7th in 2008 with a market share of 2.8%. This is an increase from 2.4% in 1983, when Seattle ranked 10th. Transit captured 3.1% of new travel over the past 25 years, while roadways accounted for 96.9%.

    #8: Philadelphia: Philadelphia slipped from the 5th largest transit market share in 1983 (4.0%) to 8th in 2008, at 2.7%. Philadelphia’s transit system, one of the most comprehensive in the nation, captured just 1.4% of new travel over the last quarter century, while roadways captured 98.6%.

    #9: Portland: Portland ranked 9th in transit market share in 2008, at 2.3%. This is a decline from 2.4% in 1983 and occurred despite opening the most extensive new light rail system in the nation over the period. Transit attracted 2.2% of new travel over the period, while roadways attracted 97.8%.

    #10: Salt Lake City: Salt Lake City, at 10th, is a new entrant to the top 10 transit market share urban areas, with a share of 2.2%. In 1983, Salt Lake City ranked 34th, with a transit market share of 0.9%. Even with this increase, however, roadways captured the bulk of new travel, at 96.2%, while transit attracted 3.8%, due to transit’s small 1983 base.

    Other Urban Areas: There were also notable developments among the urban areas that did not place in the top 10 in 2008 transit market share.

    Las Vegas: Las Vegas improved its ranking more than any other urban area, moving from 49th in 1983 to 16th in 2008 (in a tie with Atlanta, San Diego, Cleveland and Minneapolis-St. Paul). In 1983, Las Vegas had a transit market share of 0.4%, which improved to 1.2% in 2008. This was an especially notable achievement, because Las Vegas experienced substantial population growth over the period. During the period, Las Vegas established a 100% competitively contracted transit system, the only such transit system in the nation and has seen ridership expand by more than 10 times. Nonetheless, as in other gaining urban areas, such as Salt Lake City and Washington, the transit ridership base was so small that roadways captured nearly all the new demand, at 98.6% (transit obtained 1.4%).

    Atlanta: Atlanta both (1) was the fastest growing larger urban area in the developed world between 1983 and 2008 and (2) built the second most new rail capacity in the nation, in its expansion of the MARTA Metro (trailing only Washington’s Metro). Yet, Atlanta’s transit market share fell from 2.0% to 1.2% between 1983 and 2008, with transit attracting only 0.9% of new travel.

    New Rail Urban Areas: Transit market shares generally failed to increase in urban areas opening new light rail or metro systems over the period (excludes urban areas with new rail systems that were not open at the beginning of fiscal year 2008).

    • Six urban areas with new rail systems experienced market share declines, including Portland, Baltimore, Houston, Sacramento, St. Louis and Buffalo.
    • Four urban areas with new rail systems had static transit market shares, including Los Angeles, Minneapolis-St. Paul, San Jose and Dallas-Fort Worth.
    • Three urban areas with new rail systems experienced transit market share increases. The largest increase was in Salt Lake City (and the largest of any urban area). Denver and Miami-West Palm Beach also experienced increases.

    Where from Here? It might have been expected that transit would have attracted far higher ridership numbers when gasoline prices achieved such heights. Yet, nationally, transit market share increase was only from 1.5% to 1.6%, even as roadway demand was declining modestly.

    Transit’s principal marketing problem lies in its problem serving destinations outside downtown. Downtowns typically account for only 10% of urban area employment. Some trips in an urban cannot even be made on transit. For example, Portland’s extensive transit system connects only about two-thirds of the jobs and residences within the (Tri-Met) service area (Note 2). Further Tri-Met’s award deserving internet trip planner shows that some trips to outside downtown destinations can require more than two hours, even when light rail is used.


    Note 1: This data relates only to passenger transportation. Urban roadways, unlike transit, also carry a substantial amount of local and intercity freight, which is not reflected in this data.

    Note 2: According to Metro’s 2004 Regional Transportation Plan, 78% of the residences and 86% of the jobs in the Tri-Met service area were within walking distance (1/4 mile) of a transit stop. This means that approximately 67% of residences and jobs are within 1/4 mile of a transit stop (0.78 * 0.86). Metro’s plans envision this figure dropping to 59% by 2020 (this data does not include Clark County in Washington, part of which is in the urban area).

    Wendell Cox is a Visiting Professor, Conservatoire National des Arts et Metiers, Paris. He was born in Los Angeles and was appointed to three terms on the Los Angeles County Transportation Commission by Mayor Tom Bradley. He is the author of “War on the Dream: How Anti-Sprawl Policy Threatens the Quality of Life.

  • Is Pennsylvania History?

    On a recent whirlwind through Pennsylvania, I thought of James Carville, who popularized the notion that “It’s Philadelphia on one side, Pittsburgh on the other, and Alabama in the middle.” It’s a clever line, but between the Ohio and Delaware rivers he is missing a great American tapestry: the wreck of the Penn-Central, United flight 93’s final frantic moments, the social history of the Johnstown flood, and whether a state of steel and coal is past or present.

    Pennsylvania also reflects some broad truths about the nation, in particular, that stimulus plans can take forty years, the Amish have it right, the Civil War remains a personal wound, and Amtrak will never be the agent of high-speed rail.

    My first stop was Harrisburg, and I got there on a train that crossed through Amish country. I would imagine that as a community the Amish have the lowest debt-to-equity ratio in the country. There is something timeless and inspiring about their red barns and silos that flickered across the train windows, and no one needs to exhort the Amish to “Go Green.”

    In Harrisburg, as if a character in a novel by Theodore Dreiser, I walked with my grip from the station to a restaurant in the shadow of the state capitol. Later that evening I went to a high school graduation in the Concert Forum Hall, an elegant rotunda that was finished in the depths of the Depression.

    Around the circular walls are huge maps and timelines of world history. I passed the slow moments of the ceremony following Hadrian on his way into the Syrian desert and Marco Polo to the court of the Great Khan.

    Will the current stimulus money produce any buildings of such greatness? Somehow I doubt it. When the train went through Philadelphia, I saw a cheerful sign in an empty rail yard, with wording to the effect that the hot government money would get Americans back to work. The boast sounded unconvincing, as if everyone knows that stimulus money will end up funding deficits, national security advisors, and weapons contractors.

    General Robert E. Lee thought so much of Harrisburg and its strategic rail bridges that twice he embarked on campaigns to cut the main line of the Pennsylvania Railroad, and twice he failed, first at Antietam and then Gettysburg. The bridges over the Susquehanna remain, and their stone arches echo Avignon. The downtown — which looks in need of some stimulus — recalls the urban loneliness of Edward Hopper.

    From Harrisburg I drove west to Chambersburg and Mercersburg, strategic hamlets in the Civil War, but now a long way from the information superhighway. In 1864 Lee’s general, John McCausland, burned Chambersburg to the ground when the citizens failed to post his demanded ransom, which was $100,000 in gold, or $500,000 in currency (even terrorists are leery of inflated money); later, Chambersburg was the only northern town razed during in the war.

    President James Buchanan grew up in Mercersburg, a sleepy town notable today for its distinguished prep school. The log cabin in which he was born is now on the campus of Mercersburg Academy, and a nearby plaque notes that Buchanan served as U.S. Senator, ambassador to Russia and Great Britain, and Secretary of State before becoming the fifteenth president, impressive achievements for someone whose presidency is remembered as a failure, ruined by the Dred Scott decision and the drift to Civil War, which he did little to prevent.

    In a more recent conflict, United flight 93 crashed west of Mercersburg, near Shanksville, which echos the lonely farmland over which so much of the Civil War was fought. Conspiracy theories (a rare American growth industry) postulate that no plane crashed at Shanksville or that the one that did was destroyed by a missile, perhaps on orders from the trigger-happy Dick Cheney. (President Bush was finishing up My Pet Goat with the school kids.) Other theories claim that engine parts were found eight miles from the crash site and no plane debris larger than small fragments were located.

    A visit to the temporary Flight 93 memorial, however, puts to rest these and a number of other 9/11 conspiracy theories. About eighty percent of the plane was found at the site, although much of its was buried in the soft earth that had been strip mined; many local residents saw the plane hurtling intact toward the ground; the only debris found miles from the crash site was paper; and one of the engines flew several hundred yards — not miles — from the impact crater.

    The memorial to the victims of Flight 93 is budgeted to cost about $50 million, some of which has been privately raised. In design, it looks like the Vietnam Memorial in the middle of nowhere. No doubt it was a flush Congress that authorized the expenditure, even though the temporary memorial, a simple American flag at the crash site and a makeshift observation deck, looks like a better use of government resources. (Think of American tragedies remembered only with a statue in a traffic circle.)

    Forty Americans died at Shanksville. The death toll at Johnstown, just up the road, was more than two thousand when in 1889 a dam above the city broke and a wall of water washed over the gritty mill town. The tragedy is recalled in a series of memorials around the Little Conemaugh River Valley, and at a flood museum in Johnstown, which more recently has lost most of its steel production and its jobs.

    Not even the local filming of the 1977 movie Slap Shot with Paul Newman could save the economy of Johnstown, now laced with boarded storefronts, although it’s fun in the main square to imagine the presence of Coach Reggie Dunlop and the Hansons (“They brought their fuckin’ TOYS with ’em!”).

    A morality tale as well as a local disaster, blame for the Johnstown flood falls on The South Fork Fishing & Hunting Club, a mountain retreat of the super rich — Carnegie and Frick were members — that callously ignored warning signs that its South Fork Dam might give out. No wonder its so hard to win as a Republican in central Pennsylvania.

    I spent the night in Pittsburgh, no longer a steel city, but one given over to the service economy: in this case, sports stadiums, universities, finance, and hospitals. Old America made steel rails; new America entertains the masses.

    I left Pittsburgh on the The Pennsylvanian, Amtrak’s daily service to Philadelphia and New York, a remnant of the Pennsylvania Railroad, once the largest corporation on earth. After the Pennsylvania Railroad merged with the New York Central in 1968, the combined company failed less than three years later. The writer L.J. Davis said “it was more a death watch than a merger.” Penn-Central was the Enron of the 1970s. When it failed, it was the biggest bankruptcy in U.S. history.

    Here’s an overlooked cautionary tale about the delayed time reactions of government’s economic interventions: played out over thirty years, the Penn-Central merger was a big success. It took, however, the deregulation of the freight railroad business and the sale of the assets of Conrail (the successor to the bankruptcy) to the Norfolk Southern and CSX. When the dust settled, Penn-Central left the Northeast with two privately-owned railroads that are everything the shareholders had hoped for in 1968.

    On my return trip east, the train crossed the Allegheny Mountains on the Horseshoe Curve, ambled through Altoona and Lewistown, and then paused for almost forty-five minutes in Harrisburg and Philadelphia—an odd schedule for a railroad now talking up high-speed rail. Keep in mind that all the rail stimulus billions will bring is a return to the train speeds reached in the 1920s… the perfect metaphor for the illusions of government investment.

    What makes me hopeful about Pennsylvania’s future? I see optimism in the Amish red barns, the three rivers in Pittsburgh, the endurance of Johnstown, the four tracks of the main line, the federal-era houses in Harrisburg, the life of the Susquehanna, and the roadside markers like one in Chambersburg that reads: “On June 26, 1863, Gen. Robert E. Lee, and staff, entered this square.”

    What’s not to admire about a state that keeps its history so alive? I only wish it still had a steel industry and the Broadway Limited.

    Flickr Photo by Runner Jenny: 155th Pennsylvania Zouave Monument, Little Round Top, Gettysburg.

    Matthew Stevenson is the author of Remembering the Twentieth Century Limited, winner of Foreword’s bronze award for best travel essays at this year’s BEA. He is also editor of Rules of the Game: The Best Sports Writing from Harper’s Magazine. He lives in Switzerland.

  • Decentralized Growth and “Interstate” Highways in China

    Andrew Batston of The Wall Street Journal writes of China’s decentralization, with the growing employment in interior urban areas. Until the last decade, most of China’s spectacular urban population and employment growth had occurred on the East Coast, especially in the world’s largest megaregions of the Pearl River Delta (Hong Kong-Shenzhen-Dongguan-Guangzhou-Foshan-Jiangmin-Zhongshan-Zhuhai-Macao), the Yangtze Delta (Ningbo-Shaoxing-Hangzhou-Shanghai-Suzhou-Wuxi-Changzhou-Nangjing) and Beijing-Tianjin. Millions of migrant workers had traveled to the East Coast from the interior to take jobs paying far more than they could earn at home.

    But that has changed. Industrial production and jobs have expanded substantially in the interior, making it possible for people to take jobs closer to home, in Chongqing, Chengdu, Xian, Changsha, Wuhan, Shenyang, Taiyuan and many more urban areas. This is a fortuitous development, because the mega-regions are already sufficiently populated and could have well grown far larger if the interior development had not taken place.

    However, jobs have become more plentiful in the interior. China’s growing US interstate standard expressway (freeway) system has been an important contributor to this development. Like the US system, there are no grade crossings and all roadways have at least two lanes of traffic in each direction.

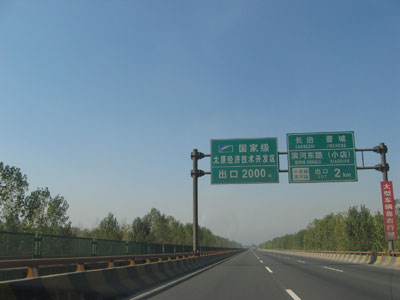
    Now, a number of interior urban areas are now within a day’s truck drive of the East Coast ports and those that are not are within two days. According to China Daily, the 65,000 kilometers (over 40,000 miles) of the national expressway system is open. This does not include extensive provincially administered systems, such as in Beijing, where four full freeway ring roads are open and a fifth is at least half complete (Beijing has six ring roads, but the first is not a freeway). Shanghai has an extensive locally administered freeway system, as do some other urban areas.

    By comparison, the US interstate system is approximately 46,000 miles (this excludes 1,000 miles of 2-lane interstate designated conventional highway in Alaska), and a total of 57,000 miles including non-interstate freeways. China is expected to displace the United States in freeway mileage by the end of the decade, when plans call for more than 60,000 miles.

    Photograph: National Expressway Route G-040 near Taiyuan, Shanxi

  • Time to Dismantle the American Dream?

    For some time, theorists have been suggesting that it is time to redefine the American Dream of home ownership. Households, we are told, should live in smaller houses, in more crowded neighborhoods and more should rent. This thinking has been heightened by the mortgage crisis in some parts of the country, particularly in areas where prices rose most extravagantly in the past decade. And to be sure, many of the irrational attempts – many of them government sponsored – to expand ownership to those not financially prepared to bear the costs need to curbed.

    But now the anti-homeowner interests have expanded beyond reigning in dodgy practices and expanded into an argument essentially against the very idea of widespread dispersion of property ownership. Social theorist Richard Florida recently took on this argument, in a Wall Street Journal article entitled “Home Ownership is Overvalued.”

    In particular, he notes that:

    The cities and regions with the lowest levels of homeownership—in the range of 55% to 60% like L.A., N.Y., San Francisco and Boulder—had healthier economies and higher incomes. They also had more highly skilled and professional work forces, more high-tech industry, and according to Gallup surveys, higher levels of happiness and well-being. (Note)

    Florida expresses concern that today’s economy requires a more mobile work force and is worried that people may be unable to sell their houses to move to where jobs can be found. Those who would reduce home ownership to ensure mobility need lose little sleep.

    The Relationship Between Household Incomes and House Prices

    It is true, as Florida indicates, that house prices are generally higher where household incomes are higher. But, all things being equal, there are limits to that relationship, as a comparison of median house prices to median house prices (the Median Multiple) indicates. From 1950 to 1970 the Median Multiple averaged three times median household incomes in the nation’s largest metropolitan areas. In the 1950, 1960 and 1970 censuses, the most unaffordable major metropolitan areas reached no higher than a multiple of 3.6 (Figure).

    This changed, however, in some areas after 1970, spurred by higher Median Multiples occuring in California.

    William Fischel of Dartmouth has shown how the implementation of land use controls in California metropolitan areas coincided with the rise of house prices beyond historic national levels. The more restrictive land use regulations rationed land for development, placed substantial fees on new housing, lengthened the time required for project approval and made the approval process more expensive. At the same time, smaller developers and house builders were forced out of the market. All of these factors (generally associated with “smart growth”) propelled housing costs higher in California and in the areas that subsequently adopted more restrictive regulations (see summary of economic research).

    During the bubble years, house prices rose far more strongly in the more highly regulated metropolitan areas than in those with more traditional land use regulation. Ironically many of the more regulated regions experienced both slower job and income growth compared to more liberally regulated areas, notably in the Midwest, the southeast, and Texas.

    Home Ownership and Metropolitan Economies

    The major metropolitan areas Florida uses to demonstrate a relationship between higher house prices and “healthier economies” are, in fact, reflective of the opposite. Between August 2001 and August 2008 (chosen as the last month before 911 and the last month before the Lehman Brothers collapse), Bureau of Labor Statistics data indicates that in the New York and Los Angeles metropolitan areas, the net job creation rate trailed the national average by one percent. The San Francisco area did even worse, trailing the national net job creation rate by 6 percent, and losing jobs faster than Rust Belt Pittsburgh, St. Louis, and Milwaukee.

    Further, pre-housing bubble Bureau of Economic Analysis data from the 1990s suggests little or no relationship between stronger economies and housing affordability as measured by net job creation. The bottom 10 out of the 50 largest metropolitan areas had slightly less than average home ownership (this bottom 10 included “healthy” New York and Los Angeles). The highest growth 10 had slightly above average home ownership (measured by net job creation). Incidentally, “healthy” San Francisco also experienced below average net job creation, ranking in the fourth 10.

    Moreover, housing affordability varied little across the categories of economic growth (Table).

    Net Job Creation, Housing Affordability & Home Ownership
    Pre-Housing Bubble Decade: Top 50 Metropolitan Areas (2000)
    Net Job Creation: 1990-2000 Housing Affordability: Median Multiple (2000) Home Ownership: Rate 2000
    Lowest Growth 10  7.4%                                2.8 62%
    Lower Growth 10 14.9%                                3.1 63%
    Middle 10 22.8%                                3.2 64%
    Higher Growth 10 30.9%                                2.6 61%
    Highest Growth 10 46.9%                                2.9 63%
    Average 24.7%                                2.9 62%
    Calculated from Bureau of the Census, Bureau of Economic Analysis and Harvard Joint Housing Center data.
    Metropolitan areas as defined in 2003
    Home ownership from urbanized areas within the metropolitan areas.

    Home Ownership and Happiness

    If Gallup Polls on happiness were reliable, it would be expected that the metropolitan areas with happier people would be attracting people from elsewhere. In fact, people are fleeing with a vengeance. During this decade alone, approximately one in every 10 residents have left for other areas.

    • The New York metropolitan area lost nearly 2,000,000 domestic migrants (people who moved out of the metropolitan area to other parts of the nation). This is nearly as many people as live in the city of Paris.
    • The Los Angeles metropolitan area has lost a net 1.35 million domestic migrants. This is more people than live in the city of Dallas.
    • The San Francisco metropolitan area lost 350,000 domestic migrants. Overall, the Bay Area (including San Jose) lost 650,000, more people than live in the cities of Portland or Seattle.

    Why have all of these happy people left these “healthy economies?” One reason may be that so many middle income people find home ownership unattainable is due to the house prices that rose so much during the bubble and still remain well above the historic Median Multiple. People have been moving away from the more costly metropolitan areas. Between 2000 and 2007:

    • 2.6 million net domestic migrants left the major metropolitan areas (over 1,000,000 population) with higher housing costs (Median Multiple over 4.0).
    • 1.1 net domestic migrants moved to the major metropolitan areas with lower house prices (Median Multiple of 4.0 or below).
    • 1.6 million domestic migrants moved to small metropolitan areas and non-metropolitan areas (where house prices are generally lower).

    An Immobile Society?

    Florida’s perceived immobility of metropolitan residents is curious. Home ownership was not a material barrier to moving when tens of millions of households moved from the Frost Belt to the Sun Belt in the last half of the 20th century. During the 2000s, as shown above, millions of people moved to more affordable areas, at least in part to afford their own homes.

    Under normal circumstances (which will return), virtually any well-kept house can be sold in a reasonable period of time. More than 750,000 realtors stand ready to assist in that regard.

    Of course, one of the enduring legacies of the bubble is that many households owe more on their houses than they are worth (“under water”). This situation, fully the result of “drunken sailor” lending policies, is most severe in the overly regulated housing markets in which prices were driven up the most. Federal Reserve Bank of New York research indicates that the extent of home owners “under water” is far greater in the metropolitan markets that are more highly restricted (such as San Diego and Miami) and is generally modest where there is more traditional regulation, such as Charlotte and Dallas (the exception is Detroit, caught up in a virtual local recession, and where housing prices never rose above historic norms, even in the height of the housing bubble). Doubtless many of these home owners will find it difficult to move to other areas and buy homes, especially where excessive land use regulations drove prices to astronomical levels.

    Restoring the Dream

    There is no need to convince people that they should settle for less in the future, or that the American Dream should be redefined downward. Housing affordability has remained generally within historic norms in places that still welcome growth and foster aspiration, like Atlanta, Dallas-Fort Worth, Houston, Indianapolis, Kansas City, Columbus and elsewhere for the last 60 years, including every year of the housing bubble. Rather than taking away the dream, it would be more appropriate to roll back the regulations that are diluting the purchasing power and which promise a less livable and less affluent future for altogether too many households.

    Note. Among these examples, New York is the largest metropolitan area in the nation. Los Angeles ranks number 2 and San Francisco ranks number 13. The inclusion of Boulder, ranked 151st in 2009 seems a bit curious, not only because of its small size, but also because its advantage of being home to the main campus of the University of Colorado. Smaller metropolitan areas that host their principal state university campuses (such as Boulder, Eugene, Madison or Champaign-Urbana) will generally do well economically.

    Photograph: New house currently priced at $138,990 in suburban Indianapolis (4 bedroom, 2,760 square feet). From http://www.newhomesource.com/homedetail/market-112/planid-823343

    Wendell Cox is a Visiting Professor, Conservatoire National des Arts et Metiers, Paris. He was born in Los Angeles and was appointed to three terms on the Los Angeles County Transportation Commission by Mayor Tom Bradley. He is the author of “War on the Dream: How Anti-Sprawl Policy Threatens the Quality of Life.

  • Curbing Euro-Envy

    Times are tough in the newspaper business. For example, The New York Times used to have a robust fact-checking department. Either the staff has been laid off or maybe they can’t keep up with the errors, either of which could explain the op-ed piece “Europe Energized.”

    Hill’s piece is classic cheerleading. He would have us believe that Europe has significantly reduced its reliance on oil, as its governments have enticed the citizenry out of cars and into mass transit and planes. Starting with the contention that Europe has the same standard of living as the United States, he indicates that Europe has made much greater progress in reducing energy use and carbon emissions.

    In fact, Europe does not enjoy the same standard of living as the United States. In 2009, the gross domestic product (purchasing power parity) was approximately one-third less ($14,000 less). For most households in Europe and the United States, that is a not an inconsequential amount of money. One reason for Europe’s lower rates of energy consumption is its historically lower income levels.

    Hill claims substantial reductions in oil consumption relative to the United States. However, Europe has not sworn off oil. Indeed, according to International Energy Agency (IEA) data, Europe’s oil consumption per capita dropped only marginally more than that of the United States between 1980 and 2006. Nor has Europe done a better job of becoming more energy efficient. Measured in tons of oil equivalence, the United States has reduced its per capita energy consumption more than Europe since 1980, again based upon IEA data. It is, of course, easier to reduce oil consumption with near static population growth.

    EU data indicates that mass transit’s market share in Europe has been declining for decades (like in the United States). Further, despite all the new high speed rail lines, cars and airplanes have accounted for the greatest travel increases. In 1995, airplanes carried a slightly smaller volume (passenger kilometers) than passenger railways, including high speed rail. By 2008, airlines were carrying 37% more passenger kilometers than rail, despite a huge expansion of high speed rail. Since 1995, at least 15 passenger kilometers have been traveled by car for every additional passenger kilometer traveled by rail, high speed or not. Meanwhile, Europe’s truck dependent freight system is less fuel efficient than America’s, which relies to a greater degree on freight railroads.

    None of this is to suggest that Europe does not lead the United States in some fields. There is no question that cars get much better mileage in Europe. By 2020, new cars are scheduled to achieve more than 60 miles per gallon, which is near double the US expectation. Europe is leading the way in automobile fuel efficiency and is demonstrating the massive extent to which improved fuel efficiency can accomplish tough environmental goals.

    Yet, curiously, no interest has been expressed by the Euro-Envious to implement European highway speed limits. Recently, Italy raised maximum speeds on some roads to 93 miles per hour, France, Austria, Denmark, Slovenia and others have 81 mile per hour limits and there are no speed limits on much of the German autobahn system. No US speed limits are this high.

    Having happily lived both within the pre-1200 (AD) boundaries of Paris and the urban fringes of four major US urban areas, it seems that both sides of the Atlantic have their strengths and weaknesses. Detailing them requires getting the facts right.

  • Urban Economies: The Cost of Wasted Time

    Much has been written in recent years about the costs of congestion, with ground breaking research by academics such as Prud’homme & Chang-Wong and Hartgen & Fields showing that the more jobs that can be accessed in a particular period of time, the greater the economic output of a metropolitan area. Greater access to jobs not only improves economic growth, but it also opens greater opportunities for people and households to fulfill their aspirations for a better quality of living.

    Congestion costs are principally the cost of wasted time, which the most recent Texas Transportation Institute (TTI) Annual Mobility Report places at $15.47 per hour. It is important to understand that much of this cost is not because the car is not moving. It is rather because time that could be used more productively is being consumed.

    Steve Polzin of the University of South Florida has raised a related issue that has been virtually absent from urban planning discussions in a Planetizen blog entitled “The Cost of Slow Travel.” Noting that transit travel time is considerably slower than auto travel times, Polzin broadly estimates that slower travel on transit costs the nation $44 billion, which is two-thirds the $66 billion. Polzin does not suggest that this is a final, “take to the bank” lost productivity number, but does suggest attention to the issue.

    Such thinking is long overdue. Wasted time is wasted time. Most wasted time occurs with respect to travel during peak periods, when most people are commuting to or from work. The $66 billion in wasted time by automobile translates into $550 per commuter per year in the United States (Based upon 2007 commuting data from the American Community Survey). The cost of wasted time for transit is 12 times as high, at $6,500 per commuter, using Polzin’s estimate. Of course, as Polzin is quick to point out, these are not final figures. However, they are a starting point for important (and perhaps “inconvenient”) economic research that has been largely kept off the agenda up until now.

  • Twenty-first Century Electorate’s Heart is in the Suburbs

    Even as the nation conducts its critically important decennial census, a demographic picture of the rapidly changing population of the United States is emerging. It underlines how suburban living has become the dominant experience for all key groups in America’s 21st Century Electorate.

    While suburban living was once seen as the almost exclusive preserve of the white upper-middle class, a majority of all major American racial and ethnic groups now live in suburbia, according to the newest report on the state of metropolitan America from the Brookings Institute. Slightly more than half of African-Americans now live in large metropolitan suburbs, as do 59% of Hispanics, almost 62% of Asian-Americans, and 78% of whites. As a result the country is closer than ever to achieving a goal that many thought would never be achieved: city/suburban racial/ethnic integration. This is particularly so in the faster growing metropolitan areas of the South and West.

    The trend is likely to continue for the foreseeable future. A majority of Millennials live in the suburbs and 43% of them, a portion higher than for any other generation, describe suburbs as their “ideal place to live.”

    The nation’s one hundred largest metropolitan areas have grown twice as fast as the rest of the country in the last decade. That growth was heavily concentrated in lower density suburbs, which grew at three times the rate of cities or inner ring suburbs. At the same time, one third of the nation’s overall population growth was due to immigration. As a result about one-quarter of all children in the United States have at least one immigrant parent. In 2008, non whites became a majority of Americans less than eighteen years old, a demographic milestone that underlines just how fast and how dramatically the country is changing. Any political party that wants to build a lasting electoral majority must align its policy prescriptions with these new demographic realities to attract the votes of a younger, more ethnically diverse population, most of which now lives in the suburbs.

    Economic opportunity continues to be the major driver in determining where people want to live and work. Five of the six fastest growing metropolitan areas in the last decade were also among the top six in job growth according to data from the Census and the Bureau of Labor Statistics analyzed by the Praxis Strategy Group. The same five metropolitan areas – Phoenix, Riverside (CA), Dallas, Houston and Washington, D.C – also ranked high in the diversity of their population, differing only in the degree of educational attainment their residents have achieved.

    With America experiencing the first decade since the 1930s in which inflation adjusted median income declined and job creation slowed to levels not seen in decades, this movement to where the jobs are located is likely to intensify, as current migration to economically buoyant Texas cities and Washington, DC suggests. This crucial factor is often overlooked by urban planners who argue that cultural amenities and sport complexes are the key to attracting new residents. In fact, metropolitan areas that focus on job creation for Millennials (young Americans born 1982-2003) and minorities have the best chance of gaining population in the next decade.

    Clearly providing higher quality public education experiences is a key part of any such economic strategy. The arrival of stealth fighter parents at local school district meetings across the country only reflects the passion among young families about the quality of education their children receive. They are unwilling to allow Boomer ideological debates to delay the changes needed to properly prepare their children for a higher educational experience that increases the odds of economic success. The traditional separation between municipal partisan politics and nominally non-partisan schools is increasingly outdated when so much of a city’s economic success depends on the quality of the education its residents receive.

    Safe neighborhoods of single family dwellings with a surrounding patch of land continue to attract families of every background to the nation’s suburbs. Metropolitan areas that provide such an environment to all of their residents are the furthest along in achieving a more integrated society. Los Angeles, for instance, which is often decried by non-residents as simply an aggregation of suburbs with no central core, has a suburban population whose demographic profile almost exactly matches the city’s population. The fact that most of its housing reflects the tract developments of the 50s and 60s, as well as the city’s low crime rates – down to levels not seen in five decades – are two key reasons for this polyglot profile.

    Rather than fighting this desire on the part of America’s 21st Century Electorate to live comfortably in the suburbs, politicians of all stripes should find ways to embrace it and advocate policies that reflect our new economic realities. For instance, rather than insisting on higher density housing and light rail systems as the only answer to the nation’s appetite for foreign oil, the federal government should adopt tax incentives that encourage telecommuting and continue policies to foster more energy efficient automobiles. If all Americans worked from home, as many Millennials prefer to do, just two days a week, it would cut that portion of our nation’s gas consumption by more than a third. The FCC’s recently announced broadband policy will help put in place the infrastructure required to make such a lifestyle possible and even more productive.

    Three out of four commuting trips involve a single individual driving their car to work and this isn’t likely to change in the foreseeable future. But putting as much emphasis on making our nation’s highways “smart” as in creating a smart electrical grid would make it possible for the existing highway system to shorten commuting time and reduce the quantity of fuel used in such trips. Recent developments in mobile technology makes this a practical, near term solution if state and local governments are prepared to invest in upgrading an infrastructure that is already designed and deployed to connect people’s homes to their workplace.

    Aligning the message at the heart of a party’s programs with the values and behaviors of America’s 21st Century Electorate is the best road towards achieving political victory –for either party – or years to come.

    Morley Winograd and Michael D. Hais are fellows of the New Democrat Network and the New Policy Institute and co-authors of Millennial Makeover: MySpace, YouTube, and the Future of American Politics (Rutgers University Press: 2008), named one of the 10 favorite books by the New York Times in 2008.

    Photo by delbz

  • Rail Transit Expansion Reconsidered

    More than two years ago we suggested in these pages that the era of multi-billion dollar system-building investments in urban rail transit is coming to an end. We wrote: “The 30-year effort to retrofit American cities with rail infrastructure, begun back in the Nixon Administration, appears to be just about over. The New Starts program is running out of cities that can afford or justify cost-effective rail transit investment. To be sure, federal capital assistance to transit will continue, but its function will shift to incrementally expanding existing rail networks and commuter rail services rather than embarking on construction of brand new rail systems.” (“Urban Rail Transit and Freight Railroads: A Study in Contrast,” February 18 2008).

    Now comes a startling new revelation from a senior U.S. DOT official that even rail extensions may be at risk. Speaking at a National Summit on the Future of Transit before an audience of leading transit General Managers on May 18, Federal Transit Administrator Peter Rogoff questioned the wisdom of expanding rail networks when money is badly needed to maintain and modernize existing facilities:

    “At times like these, it’s more important than ever to have the courage to ask a hard question: if you can’t afford to operate the system you have, why does it make sense for us to partner in your expansion? If you can’t afford your current footprint, does expanding that underfunded footprint really advance the President’s goal for cutting oil use and greenhouse gases… Or are we at risk of just helping communities dig a deeper hole for our children and our grandchildren?”

    In Rogoff’s judgment, the first priority for the transit industry is to follow the precept “fix it first.” “Put down the glossy brochures, roll up our sleeves, and target our resources on repairing the system we have,” he told the assembled transit officials. Transit systems that don’t maintain their assets in a state of good repair risk losing riders, he warned. The Administrator cited the preliminary results of an FTA study of the financial needs of 690 public transit systems across America that show a $78 billion backlog of deferred maintenance. Fully 29 percent of all transit assets are “in poor or marginal condition.” The challenge facing transit managers is to resist the siren call of new construction and devote money to the “unglamorous but absolutely vital work of repairing and improving our current systems.”

    At first blush Rogoff’s position would appear to go counter to the Administration’s announced policy of favoring public transit. Hasn’t Transportation Secretary Ray LaHood repeatedly championed public transit as an alternative to highway expansion? Hasn’t the Administration’s proposed Fiscal Year 2011 budget include major commitments to funding new rail lines in Denver, Honolulu, Minneapolis and San Francisco? Hasn’t the Federal Transit Administration dropped the former emphasis on cost-effectiveness as an evaluation factor in rail project selection in favor of a broader range of factors? All true.

    But fiscal realities can do wonders to bring federal officials down to earth. The Transit Account of the Highway Trust Fund is barely solvent. The U.S. DOT budget will grow by only one percent in 2011. With commendable consistency and fairness, the Administration seems to have decided to apply the same investment standard to transit as it has preached and laid down for highways: Forget about massive capacity expansion; focus on getting the most out of the assets already in place by maintaining them in a state of good repair. To critics of the DOT’s new posture – and there will be some – a good answer could be: It’s just a different way of looking at what it means to be pro-transit.

  • The Limits Of The Green Machine

    Environmentalism is strangely detached from the public’s economic goals.

    The awful oil spill in the Gulf–as well as the recent coal mine disaster in West Virginia–has added spring to the step of America’s hugely influential environmental lobby. After years of hand-wringing over global warming (aka climate change), the greens now have an issue that will play to legitimate public concerns for weeks and months ahead.

    This is as it should be. Strong support for environmental regulation–starting particularly under our original “green president,” Richard Nixon–has been based on the protection of public health and safety, as well as the preservation of America’s wild spaces. In this respect, environmentalists enjoy widespread support from the public and even more so from the emerging millennial generation.

    Conservatives who fail to address this concern will pay a price, even more so in the future. The Bush administration’s apparent clubbiness with conventional energy interests has undermined the GOP’s once-proud legacy on environmental causes. The oil spill could prove a great campaign issue for Democrats assigning blame for the disaster on lax Republican regulators and their oil company chums.

    But there’s also a danger for Democrats who tilt uncritically toward “green” policies. Instead of following the environmentalists’ party line, they should adopt a balanced approach adding both economic and social needs to their concept of “sustainability.”

    Sadly, many in the administration seem anxious to extend environmental regulation into virtually every aspect of life. Legitimate concerns over pollution and open space preservation, for example, have now been conflated with a renewed drive to strangle suburbia in favor of forced densification.

    The administration’s “livability” agenda, as suggested by Transportation Secretary Ray LaHood, for example, proposes policies that favor dense urban development over the dispersed living preferred by most Americans. This, notes analyst Ken Orski, represents an unprecedented federal intrusion over traditional local zoning and local decisions.

    This centralizing tendency supports a wide array of interests, notably big city mayors and urban land speculators, and also is eagerly promoted by many architects, the media and planning professors. Not surprisingly, less intrusive ways to reduce energy use, such as telecommuting or the dispersion of worksites closer to people’s homes, have elicited very little administration support.

    Herein lies the Achilles heel of environmentalism–its profound disconnect from public preferences and aspirations. By embracing such a radical social engineering agenda, the greens may end up undermining their own long-term effectiveness.

    The first sign of this pushback, notes analyst Walter Russell Mead, can be seen in growing skepticism about climate change policies both here and in Europe. At a time of severe economic challenges, greens and their political allies need to consider how specific environmental costs threaten an already beleaguered middle and working class.

    Voters, for example, may support strong penalties and stricter controls of energy giants such as British Petroleum or Massey Energy, but roughly six in 10, according to a post-spill NBC/Wall Street Journal poll, continue to back the idea of expanded offshore oil drilling. Voters may embrace new environmental improvements but they also want to keep their jobs.

    This conflict will be on display in the coming struggle over the “cap and trade” proposals in the Senate. Strongest opposition comes from those states and regions most adversely impacted by strict limits on carbon, clustered in the south and Midwest.

    Mitch Daniels, governor of coal-dependent Indiana, even has denounced such proposals as Washington “imperialism.” But Daniels’ opposition also is shared by many Democrats from fossil-fuel-rich states such as North Dakota, West Virginia and Louisiana. Cap and trade even manages to offend many on the left, who see it as yet another opportunity for Wall Street to profit from complex federal regulation.

    On the state level, more draconian mandates on shifting to renewable fuels, such as those in place in California, could also cause future power shortages, as the state auditor warned recently. Such concerns are routinely brushed aside by environmentalist and their prodigious PR machines who prattle on about our coming economic salvation through the creation of “green jobs.”

    In reality, given their dependence on massive subsidies from both taxpayers and rate-payer, it’s unlikely that renewables, as opposed to relatively clean alternatives such as plentiful natural gas, will produce a net positive impact on the economy for years or even decades. Certainly highly aggressive subsidies for wind and solar have not proved any kind of elixir in countries like Spain, where such policies have been long in place but now are being scaled back due to their drain on both the economy and the public budget.

    To some extent, the hype over “green jobs” sometimes appears as something of a PR smokescreen. Prominent greens have long been opposed to the very idea of economic growth and wealth creation, particularly in advanced industrial countries. For decades John Holdren, President Obama’s science advisor, has favored what he calls “de-development” of Western countries in order to preserve natural resources and reduce pollution.

    This approach appears to be gaining support even as the pain of economic dislocation has devastated the advanced countries of the West. Boston University sociologist Juliet Schor, writing in the influential left-leaning The Nation, even attacks “progressive economists”- such as those calling for a second New Deal- for focusing on “climate destabilizing growth” as a way to create new jobs and raise middle class incomes.

    In the Huffington Post one-time investment banker Ann Lee, now an economics professor at NYU, has called for “a new economic ideology” that focuses on “human dignity, creative and degrees of freedom” instead of following traditional measurements of material well-being. This “new” economy, she argues, would provide greater returns to favored groups like artists and, of course, teachers, who she considers severely underpaid.

    This kind of low-carbon academic “esteem” economy appeals to people who already enjoy considerable material wealth and can count on the support of the state. It is not so promising on the West’s aspirational middle and working classes, particularly those employed in the private sector, whose individual strivings would now be compensated by a deadly combination of high taxes and slow growth.

    Until the issues of growth are tackled honestly, the green movement will continue to depend on tragic events such as the Gulf oil spill to maintain its public support. But in the long run, environmentalism will not remain politically “sustainable” if it fails to balance a green future with the economic aspirations of current and future generations.

    This article originally appeared in Forbes.com.

    Joel Kotkin is executive editor of NewGeography.com and is a distinguished presidential fellow in urban futures at Chapman University. He is author of The City: A Global History. His newest book is The Next Hundred Million: America in 2050, released in Febuary, 2010.

    Photo by just.Luc