Tag: Transportation

  • Ruining our Cities to Save Them

    Latching onto Kevin Rudd’s call for “a big Australia” and forecasts that our population will grow by 60 per cent to 35 million in 2050, urban planners are ramping up their war against suburbia. In paper after paper, academics across the country have been pushing the same line. Climate change, peak oil and the financial crisis mean we can’t go on driving and borrowing for low-density housing. Choices must be narrowed to buying or renting compact homes in high-density, multi-unit developments along public transport corridors, preferably rail lines.

    Underlying it all is a radical vision of suburban doom. “That is one of my themes”, said Professor Peter Newman, anti-car activist and head of Curtin University‘s Sustainable Policy Institute, “that we stop cities developing into eco enclaves surrounded byMad Max suburbs”.

    The alarming truth is that planners are blasé about prosperity, living standards and choice because they see them as second-rate issues. The point is to save us from eco-apocalypse.

    And their voice grows louder by the day. The mantra of green urbanism has long been heard on ABC radio programs like Background Briefing and Future Tense, but matters reached a crescendo in January when ABC TV’s 7:30 Report rounded up the usual suspects for a four-part series on preparing our cities for the population boom. Framed by scary graphics and a menacing soundtrack, the series delivered a stream of breathless dialogue from talking heads like Newman, who declared that “if we just roll out those suburbs one after the other, making a more and more carbon intensive world in our cities, then we’re stuffed.”

    This current of thought has always lurked beneath the Rudd Government’s “nation building” agenda. But last October it burst open when the prime minister announced his plans to wrest control of urban policy from the states.

    Rattling off tenets of the planning ideology, Mr Rudd said “we must ensure that communities are not separated from jobs and services”, that “increasing density in cities is part of the solution to urban growth”, that “forms of development need to be fully integrated with current and future transport networks”, that “climate change requires a whole of government response”, and that “we must make long-term investments in transport networks that minimise carbon emissions.” It’s all a question of government action, if he is to be believed.

    That too was the message from infrastructure minister Anthony Albanese at the recent launch of State of Australian Cities 2010. Little wonder that he appointed Newman to the board of Infrastructure Australia.

    Defying urban laws of gravity

    “Cities are an immense laboratory of trial and error, failure and success” said the great urbanist Jane Jacobs, but today’s planners seem to think they’re as pliable as dough. Just tweak a couple of variables, say transport modes and population densities, and everything falls into place.

    As a discipline, urban planning never emerged from behind Berlin Wall of command economics, albeit with a green face. Early hopes that the financial crisis would shift public sentiment in this direction have faded, and climate change hasn’t registered as an issue for commuters and home buyers.

    Despite this, planners show no sign of losing confidence in their power to abolish fundamental laws of supply and demand. They’re still apt to dream up grand schemes for zoning, development and infrastructure controls with barely a thought about the impact on land values and bid-rents, two price inputs with far-reaching implications for urban commerce.

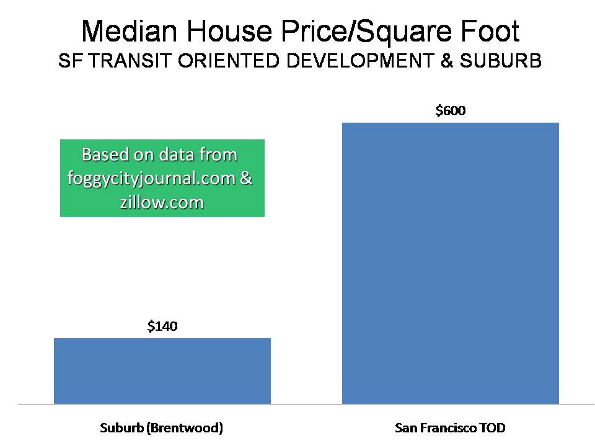
    Nor have they managed to repeal the law of unintended consequences. Year after year, the Demographia housing affordability survey confirms the link between “more prescriptive land use regulation” and high median house prices. This is elementary economics. Restricting the supply of land for development, a starting point for all green planning, combined with rising demand from population growth, will ratchet up values, with knock-on effects for the whole economy. The survey continues to rank all of our capital cities, and some of our regional centres, in the “severely unaffordable” category. No amount of “cutting-edge design” or “more imaginative” planning can counter this effect.

    The claim that concentrating development in dense “activity centres”, “urban villages” or “transport corridors” will ease the problem is a sham. Development controls will always drive up the price of land. When planners talk about affordability in this context, they really mean inferior housing in terms of space, amenity and title, even if it’s dressed-up as “design innovation” or “green rated building”.

    But inferior quality may not be enough to compensate for escalating land values, so consumers get less housing for higher prices. And more are stuck renting instead of buying. Large numbers of low to middle income earners will be shut out of the housing market

    Interestingly, Perth appears in Demographia’s “severely unaffordable” category along with Sydney and Melbourne, despite having only around a quarter of the population. Newman neglected this detail while praising the city’s rail network on the 7:30 Report.

    Though Perth can fall back on the resources boom, south-eastern cities aren’t so lucky. They are service-based regions with very dispersed patterns of employment, even by world standards.

    Writing in a publication of the 2008 9th World Congress of Metropolis, Sydney University’s John Black observed that “apart from some noticeable peaks, employment density is quite uniform across the [Sydney metropolitan] region”. According to the NSW Department of Transport, only 12 per cent of Sydney’s jobs are in the CBD and second tier centres like North Sydney, Chatswood, Parramatta, Hurstville and Penrith have less than 2 per cent each. David McCloskey, Bob Birrell and Rose Yip of Monash University (demographers, not urban planners) report the same about Melbourne. The CBD hosts around 20 per cent of jobs and the rest are scattered all over the metropolitan region.

    Platitudes like “we must locate people close to where they work”, or “we must locate jobs close to where people live”, have little basis in reality. They infringe another immovable law of economics, relating to economic rents or bid-rents. This mechanism determines how industries and firms are distributed. Put simply, a parcel of land will go to whichever use delivers the highest profits. Centrally located land (near major transport or infrastructure hubs) commands high prices, and goes to the most profitable uses. Peripheral land goes to less profitable or marginal activities.

    Over the last thirty years, economic deregulation, flexible transport, advanced communications and population growth have raised up a sector in the latter category, extracting value from cheap outer-metropolitan land and low rents. It includes industries like transport and distribution, building and construction, food, consumer products, personal services, wholesale and retail. They depend on favourable location costs and proximity to urban markets and labour pools. According to the Greater Western Sydney Economic Development Board, “prime industrial land with direct access to transport infrastructure is 75% cheaper [in GWS] than other areas of Sydney”.

    Ultimately, green planning will phase out cheap urban land, undermining this sector and destroying jobs in the process. Breakthroughs in automotive and energy technologies offer the prospect of adaptation to a distant future of expensive oil. There’s no way to adapt to rising land values.

    Green rated chaos

    Many are in denial about this, recycling visions of the “concentric ring model” of urban form. This relic of pre-war sociology allocated industry to the core, or cores, and residences to the periphery. Take the Sydney Morning Herald sponsored Long Term Public Transport Plan, recently released with great fanfare. Authored by a committee of green-tinged experts and academics, the plan proclaims, according to a Herald feature, that “Sydney retains a strong centre-based structure, with nearly 40 per cent of the city’s jobs and most of its major retail, educational and entertainment facilities located within 26 key centres”. This is an essential precondition for the proposed network of denser rail infrastructure.

    But the plan’s own figures don’t add up to Sydney having a “strong centre-based structure”. A hefty 60 per cent of jobs aren’t centralised and the plan actually cites 33 “centres” flung all over the Sydney region, from Norwest Business Park in the north, to Penrith in the west and Hurstville in the south. Apart from the CBD with 12 per cent, none of the centres have more than 1.8 per cent of Sydney’s jobs.

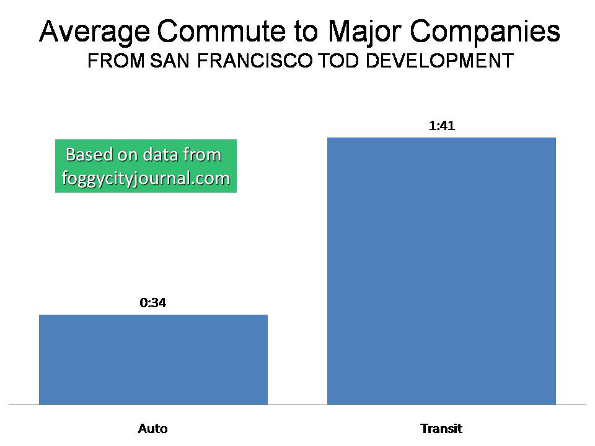
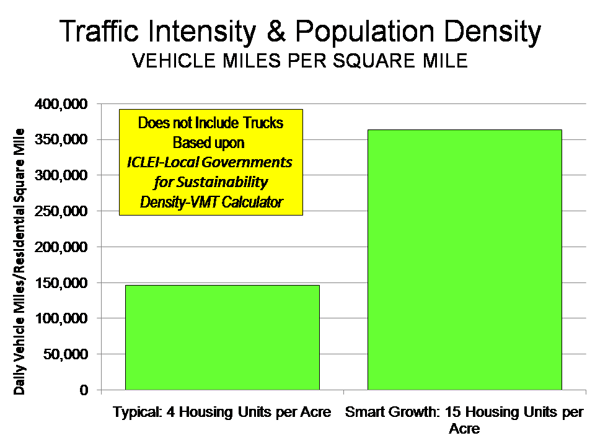
    Concentrating housing in a city of dispersed jobs means horrendous traffic congestion, the costs of which loom large in State of Australian Cities 2010. Currently, around 72.3 per cent of Sydney’s people drive to work. No configuration of public transport will be efficient, leaving motorists to converge on dense localities. This is a city projected to explode from today’s 4.2 million people to 7 million in 2050. In Melbourne’s case, McCloskey, Birrell and Yip state plainly that raising densities along tram and train lines will end in chaos. Of the 1.4 million people who work outside central Melbourne, only 4.4 per cent use public transport.

    On the other hand, attempts to concentrate jobs will throw thousands onto the dole queues. At least this is a type of solution: the unemployed don’t commute.

    Ironically, some thriving “centres” in the Herald plan wouldn’t exist without the expansion of Sydney’s arterial road network. Examining the “edge city” phenomenon in Sydney, Peter Murphy and Robert Freestone conceded, way back in 1994, that the jobs-rich “global arc corridor” owed a lot to strategic road junctions like the intersection of Lane Cove Road with Epping Road in North Ryde and with the Pacific Highway in Gordon.

    “The most prestigious development has overwhelmingly favoured the middle-ring northern and north-western parts of Sydney in centres easily accessible by car …” say Murphy and Freestone, having explained that “there are now diversified employment centres in the suburbs which have grown up almost despite, rather than because of, traditional land-use planning policies”. These days the NSW Government bows to green intimidation, failing in its new Metropolitan Transport Plan to complete the highly successful Orbital Motorway Network, leaving M4 West, the F3 link and duplication of the M5 tunnel in limbo.

    Demands that at we reshape our cities to fight climate change are illogical. Let’s assume, for argument’s sake, that there’s a case to cut Australia’s 1.4 per cent contribution to global carbon. Even the Australian Conservation Foundation’s Consumption Atlas ranks urban settlement patterns well below the general level of consumption as a factor in emissions. And general consumption is a function of living standards, not urban form. Since the world is far from putting constraints on consumption, calls for a transformation of settlement patterns are baseless.

    But it’s worse. The Consumption Atlas and an analysis by Demographia’s Wendell Cox disclose that emissions across affluent inner-urban areas exceed those on the fringe. By focusing on settlement patterns rather than consumption levels, green planners engage in a form of class discrimination. The costs of climate change are heaped on outer-suburban working people, who lose jobs, mobility and housing amenity, while the affluent emerge unscathed.

    This article first apeared at The New City Journal

    Photo by Amit (Sydney)

  • Forced March To The Cities

    California is in trouble: Unemployment is over 13%, the state is broke and hundreds of thousands of people, many of them middle-class families, are streaming for the exits. But to some politicians, like Sen. Alan Lowenthal, the real challenge for California “progressives” is not to fix the economy but to reengineer the way people live.

    In Lowenthal’s case the clarion call is to take steps to ban free parking. This way, the Long Beach Democrat reasons, Californians would have to give up their cars and either take the bus or walk to their local shops. “Free parking has significant social, economic and environmental costs,” Lowenthal told the Los Angeles Times. “It increases congestion and greenhouse gas emissions.”

    Scarily, his proposal actually passed the State Senate.

    One would hope that the mania for changing how people live and work could be dismissed as just local Californian lunacy. Yet across the country, and within the Obama Administration, there is a growing predilection to endorse policies that steer the bulk of new development into our already most-crowded urban areas.

    One influential document called “Moving Cooler”, cooked up by the Environmental Protection Agency, the Urban Land Institute, the Environmental Defense Fund, Natural Resources Defense Council, the Environmental Protection Agency and others, lays out a strategy that would essentially force the vast majority of new development into dense city cores.

    Over the next 40 years this could result in something like 60 million to 80 million people being crammed into existing central cities. These policies work hard to make suburban life as miserable as possible by shifting infrastructure spending to dense areas. One proposal, “Moving Cooler,” outdoes even Lowenthal by calling for charges of upwards of $400 for people to park in front of their own houses.

    The ostensible justification for this policy lies in the dynamics of slowing climate change. Forcing people to live in dense cities, the reasoning goes, would make people give up all those free parking opportunities and and even their private vehicles, which would reduce their dreaded “carbon imprint.”

    Yet there are a few little problems with this “cramming” policy. Its environmental implications are far from assured. According to some recent studies in Australia, the carbon footprint of high-rise urban residents is higher than that of medium- and low-density suburban homes, due to such things as the cost of heating common areas, including parking garages, and the highly consumptive lifestyles of more affluent urbanites.

    Moreover, it appears that even those who live in dense places may be loath to give up their cars. Over 90% of all jobs in American metropolitan regions are located outside the central business districts, which tend to be the only places well suited for mass transit.

    Indeed, despite the massive expansion of transit systems in the past 30 years, the percentage of people taking public transportation in major metropolitan regions has dropped from roughly 8% to closer to 5%. Even in Portland, Ore.–the mecca for new wave transit consciousness–the share of people using transit to get to work is now considerably less than it was in 1980. In recent months overall transit ridership nationwide has actually dropped.

    These realities suggest that densification of most cities–with the exceptions of New York, Washington and perhaps a few others–cannot be supported by transit. Furthermore, drivers in dense cities will be confronted with not less congestion, but more, which will likely also boost pollution. The most congested cities in the country tend to be the densest, such as Los Angeles, Sen. Lowenthal’s bailiwick, which is in an unenviable first place.

    Then there is the little issue of people’s preferences. Urban boosters have been correct in saying that until recently there have been too few opportunities for middle-class residents to live in and around city cores. But over the past decade many cities have gone for broke with dense condo and rental housing and have produced far more product, often at very high cost, than the market can reasonably bear.

    Initially, when the mortgage crisis broke, the density advocates built much of their case on the fact that the biggest hits took place in suburban areas, particularly on the fringe. Yet as suburban construction ended, cities continued building high-density urban housing–sometimes encouraged by city subsidies. As a result, in the last two years massive foreclosures have plagued many cities, and many condominiums have been converted to rentals. This is true in bubble towns like Las Vegas and Miami; “smart-growth” bastions like Portland and Seattle; and even relatively sane places such as Kansas City, Mo. All these places have a massive amount of high-density condos that are either vacant or converted into lower-cost rentals.

    Take Portland. The city’s condo prices are down 30% from their original list price. The 177-unit Encore, one of the fanciest new towers, has closed sales on 12 of its units as of March, while another goes to auction. Meanwhile in New York half-completed structures dot Brooklyn’s once-thriving Williamsburg neighborhood, while the massive Stuyvesant Town apartment complex in Manhattan teeters at the edge of bankruptcy.

    Finally, it is unlikely that cities would be able to accommodate the massive growth promoted by urban boosters, land speculators and policy mavens. Aaron Renn, who writes the influential Urbanophile blog, says that most American cities today struggle to maintain their current infrastructure. They also have limited options to zone land for high-density construction, due in part to grassroots opposition to existing residential neighborhoods. Overall they would be hard-pressed to accommodate much more than 10% of their region’s growth, much less 50% or 60%.

    Given these realities, and the depth of the current recession, one might think that governments would focus more on basics like jobs and fixing the infrastructure–in suburbs as well as cities–than reengineering how people live. Yet it is increasingly clear that for many “progressives” the real agenda is not enabling people to achieve their dreams–especially in the form of a suburban single-family house. It is, instead, forcing them to live in what is viewed as more ecologically and socially preferable density.

    In the next few months we may see more of the kind of hyperregulation proposed by the likes of Sen. Lowenthal. It is entirely possible that a hoary coalition of HUD, Department of Transportation and EPA bureaucrats could start trying to restrict future housing development along the lines suggested in “Moving Cooler.”

    Yet over time one has to wonder about the political efficacy of this approach. Right now Americans are focused primarily on simply economic growth–and perhaps a touch less on the intellectual niceties of the “smart” form. In addition they are increasingly skeptical about climate change, which serves as the primary raison d’etre behind the new regulatory schema.

    Given the zealousness of the density advocates, perhaps the only thing that will slow, and even reverse, this process will be the political equivalent of a sharp slap across the face. Unless the ruling party begins to reacquaint itself with the preferences and aspirations of the vast majority of Americans, they may find themselves experiencing repeats of their recent humiliating defeat–manufactured largely in the Boston suburbs–in true-blue Massachusetts.

    Americans–suburban or urban–may resist a return to unbridled and extreme Republicanism, whether on social issues or in economic policy. But forced to choose between Neanderthals, who at least might leave them alone in their daily lives, and higher-order intellects determined to reengineer their lives, they might end up supporting bipeds lower down the evolutionary chain, at least until the progressive vanguard regains a grip on common sense.

    This article originally appeared at Forbes.com.

    Joel Kotkin is executive editor of NewGeography.com and is a distinguished presidential fellow in urban futures at Chapman University. He is author of The City: A Global History. His newest book is The Next Hundred Million: America in 2050, released in Febuary, 2010.

    Photo: Creativity+ Timothy K Hamilton

  • Transit Oriented Development: If Not San Francisco, Where?

    “The Great Transit Oriented Development Swindle?” reads the headline in the Fog City Journal, one of the growing number of internet newspapers providing serious, professional web-based journalism as an alternative to declining print newspapers (and their often less than effective web sites).

    The article does not directly answer the question in the headline, but certainly provides enough ammunition to what has become a commonly accepted mantra among planners and urban boosters. It reveals how transit oriented development (TOD) is often based upon fragile foundations that amount to an ideological swindle. It is important to recognize that the Fog City Journal is no right wing or libertarian organ. There is little market for that in the city of San Francisco. The leftish bent of the Fog City Journal, combined with author Marc Salomon’s unusually incisive (and footnoted) analysis makes this article noteworthy. It also seems clear that the author is a proponent of more transit service and funding, not less – even though he is highly skeptical about the current TOD craze.

    Transit Oriented Development: The idea behind transit oriented development is that, in new, higher density developments, people use transit more and cars less. Transit oriented development has become a first principle of some, who seem to believe that cities can become vibrant in part by strangling new suburbs out of existence. Transit oriented development is at the very heart of the Obama Administration’s “livability agenda,” and is frequently cited admiringly by Secretary of Transportation Ray LaHood.

    Eastern Neighborhoods: Salomon’s subject is San Francisco’s Eastern Neighborhoods, where transit oriented development is proposed. From the beginning Salomon identifies a fundamental problem: “Transit Oriented Development is predicated upon the notion that existing transit infrastructure is attractive enough such that residents of new units will take transit to work instead of drive. He continues: “The existing transit system, both regional and local, is not capable of handling existing demand.”

    Salomon correctly notes that “San Francisco is not the regional employment center.” In fact, nearly 90% of employment in the San Francisco-San Jose area is not in downtown San Francisco. Indeed, Silicon Valley, not downtown San Francisco, has long been the largest employment center in the area and there are also major job concentrations in the suburban belt east of Oakland.

    No Better Place for Transit Oriented Development: Yet, there are few places in the world better served by transit than the Eastern Neighborhood transit oriented development. The project is no more than a long walk from downtown San Francisco (Figure 1). Residents will be able to access frequent “Muni” bus services. The development would be well served by BART (the regional metro), midway between two stations, both of which access four routes. There are few places in the world where a non-transfer station serves that many routes. Salomon analyzes transit from the center of the development, the corner of Mission and 20th Streets.

    Transit Oriented Development: Forcing Longer Commutes: Salomon’s concern starts with the recognition that these systems are already overcrowded. However there is more. Even with their heavy (and highly subsidized) loads, the virtually unparalleled level of transit service available from Mission and 20th cannot compete with the automobile. Salomon’s analysis shows that, on average, transit oriented development residents working at jobs at the 30 largest firms in the San Francisco Bay area would spend nearly 3.5 as much time traveling to work by transit than if they drove themselves. The best transit travel time would be more than double the auto travel time, while the worst would near five times (Figure 2).

    Transit Oriented Development: Making Traffic Congestion Worse: Mirroring the research on the association between higher densities and greater traffic congestion, Salomon suggests that without substantial additional transit spending, transit oriented development “in San Francisco will most likely diminish transit reliability by increasing auto trips–the precise opposite of transit oriented development’s stated goals.” On this point, however, it is well to remember that no transit system has ever been seriously conceived, much less proposed or implemented that could provide competitive mobility between Mission and 20th and the dispersed employment throughout the San Francisco Bay Area. A transit system that reaches all of the dispersed employment in a modern American or European urban area at travel times competitive with the car could require annual expenditures that approach or even exceed the gross domestic product of the area.

    Unaffordable Transit Oriented Development: But Salomon is not through. Insufficient transit service is only part of the problem. There is a fundamental problem with the thesis that “cities need to densify their urban cores to support greater densities of development.” But, he says, “this is predicated upon the assumption that housing in the urban core and periphery are fungible, that the core and periphery compete interchangeably for buyers.”

    Unlike most urban advocates and the Secretary of Transportation, it is apparent that Salomon understands the first principle of “livability.” Livability requires affordability. In San Francisco suburb of Brentwood, for example, Salomon notes that the median house price is $298,000. Brentwood is located in eastern Contra Costa County, approximately 50 miles from downtown San Francisco. But there is no need to travel that far, since there is an abundance of jobs much closer.

    This compares to a median price of $627,000 for an apartment/condominium near the proposed transit oriented development in San Francisco. Further, the house in Brentwood will be more than double the size of condo in the transit oriented development, as data from zillow.com indicates. Thus, the new home buyer will pay less than one-fourth the cost per square foot in Brentwood compared to the transit oriented development (Figure 3). The Brentwood household will also enjoy a backyard that would not come with a 23rd floor flat.

    Lifestyles of the Few: None of this is to suggest that transit oriented development cannot be attractive. The mistake, however, is the outsized enthusiasm of its proponents. Like a Mini Cooper or sportscar, transit oriented development serves the needs and wants of a narrow niche market, but by no means anything close to the majority.

    Salomon concludes:

    In order for transit oriented development to check sprawl, prospective home buyers would be expected to make the choice between purchasing a $300K unit in Brentwood or a unit costing twice that much in San Francisco. Further, in order to check motor vehicle commutes, the assumption would be that someone paying that urban location premium would more than double their commute time by taking transit.

    Simply stated, many of the claims of transit oriented development proponents simply do not “pencil out.” TOD residents will have to drive, unless their jobs are within walking distance. Further, in the dynamic economy that has developed in US urban areas, few can assume that they will always work in the same place. Most importantly, however, very few suburbanites could afford the tony TODs. That’s not a problem, however, since most of them are probably not sorely tempted.

    Photograph: Market Street Toward the Ferry Building, San Francisco

    Wendell Cox is a Visiting Professor, Conservatoire National des Arts et Metiers, Paris. He was born in Los Angeles and was appointed to three terms on the Los Angeles County Transportation Commission by Mayor Tom Bradley. He is the author of “War on the Dream: How Anti-Sprawl Policy Threatens the Quality of Life.

  • The Harvard $7 Per Gallon Study: Missing the Point Completely

    A new study by researchers at the Belfer Center for Science and International Affairs at Harvard University suggests that President Obama’s greenhouse gas (GHG) reduction goal will require gasoline prices of from $7.15 to $8.71 per gallon by 2030. This is not only untrue, but also represents a “roadmap” to economic and environmental folly.

    The study begins with the assumption that the transportation sector would need to reduce its GHG emissions by the same 14% percentage as the overall goal for the economy, as proposed by President Obama (Note).

    “Across the Board Reductions” are Absurd: The Harvard assumption is flawed from the start. GHG emissions reduction is not about “across the board” reductions of the same percentages applied to economic sectors. Such an approach could result in serious misallocation of resources, as opportunities for less expensive GHG emissions reductions in some sectors are ignored, while more expensive strategies are implemented in other sectors.

    The Appropriate Price for GHG Reduction: The study itself assumes that the present GHG price is $30 and that the price will rise to $60 by 2030. Reports by the Intergovernmental Panel on Climate Change and McKinsey/The Conference Board say that sufficient GHG emission reductions can be achieved at below $50 per ton. It is fair to suggest, therefore, that any strategy costing more than the $50-$60 range must be rejected as being too expensive.

    The Harvard study notes that GHG

    …prices at their projected levels are far too small to create a significant incentive to drive less. Fuel prices above $8/gallon may be needed to significantly reduce U.S. GHG emissions and oil imports.

    This should tell us something. Achieving the proposed reduction is GHG emissions from the transportation sector is just too expensive. If the current market price for GHG emissions cannot significantly reduce gasoline usage, then strategies that can be achieved for the market price should be implemented (in other sectors). Such an approach would by no means interfere with the potential to achieve GHG emissions reductions, rather it would facilitate less disruptive achievement.

    $7 Per Gallon Gasoline: The Harvard study goes on to suggest that gasoline prices of $7.15 to $8.71 per gallon by 2030 might be necessary to achieve the overall GHG reduction goal in the transportation sector. These higher prices would be the result of significantly higher fuel taxes. The resulting cost of GHG emissions reductions could be more than $500 per ton (compared to the Department of Energy 2030 gasoline price projection). While the Harvard report “poo-poos” the economic impact of doubling gasoline prices, a Reason Foundation report (and previous research at the University of Paris by Remy Prud’homme and Chang Wong Lee) has found a strong relationship between mobility (driving more) and economic growth.

    Focusing on Ends, Not Means: No one should believe it will be easy to achieve any eventual GHG emission objective. Success will be greatly enhanced by focusing on “ends” rather than “means.” This means employing the least costly and least disruptive strategies, without regard to how much we drive, where we live, how much power we consume or any other peripheral (and irrelevant) consideration.

    At a price of $500 or more, the Harvard report’s price per ton could be nearly 10 times as much as the $60 GHG price assumed in the very same report. Such an increase in the price of gasoline would be both absurd and unnecessary.

    ——

    Note: There are multiple proposals for economy wide GHG emissions reductions. Congressional have been for 17% to 20% reductions by 2020.

  • New Traffic Scorecard Reinforces Density-Traffic Congestion Nexus

    Inrix, an industry provider of traffic information, has just published its third annual Traffic Scorecard, which ranks the nation’s 100 largest metropolitan areas based upon the intensity of their peak hour traffic congestion in 2009. The results provide further evidence of the association between higher urban population densities and more intense traffic congestion.

    Los Angeles, Again: Not surprisingly, Los Angeles is again the most congested metropolitan area over 1,000,000 population. In Los Angeles, roadway travel takes nearly 34.7% more in peak periods than when there is no congestion. This means that a trip that would take 30 minutes without congestion would take, on average 40.5 minutes during peak periods.

    The principal measure used by Inrix is the Travel Time Index, which was developed by the Texas Transportation Institute (TTI), for its congestion reports that started in 1982. TTI’s latest Urban Mobility Report is for 2007. The Inrix measures are developed from actual GPS vehicle readings. This information is also provided to TTI to assist in preparation of its annual Urban Mobility Report.

    Measuring Delay: In the new edition, Inrix switches from using the Travel Time Index to what it calls the Travel Time Tax. The difference between the two measures is that the Travel Time Tax measures the percentage of delay, such as 35% in Los Angeles, while the Travel Time Index would state the figure as 1.35. The new method is preferable because differences in traffic congestion are more readily apparent. . For example, a metropolitan area having a Travel Time Tax of 15% would have 50% worse traffic congestion than a metropolitan area having a Travel Time Tax of 10%. This large difference is not as obvious when comparing the Travel Time Index values of 1.15 and 1.10. The “Travel Time Tax” parlance, however, is less than optimal and this article will use “average congestion delay” instead.

    Ranking the Metropolitan Areas: The average congestion delay in Los Angeles was much worse than in the other largest metropolitan areas, just as its core urban area density is well above that of anywhere else in the US, including New York (where far less dense suburbs more than negate the density advantage in the core city). It also doesn’t help that a number of planned freeways were cancelled in Los Angeles over the last 50 years.

    Among the large metropolitan areas, Washington, DC had the second worst Average congestion delay, at 22.4%, followed by San Francisco, at 21.5%, Austin at 20.7% and New York at 19.7%. Austin may seem to have placed surprisingly high, however this was the nation’s last large metropolitan area to open a full freeway to freeway interchange and has only recently begun to develop a comprehensive freeway system, through the addition of toll roads. Austin’s late roadway development is the result of two factors. Austin was too small in 1956 to receive a beltway under the interstate highway system and an anti-freeway movement delayed construction for decades.

    Inrix also develops an average congestion delay for the worst commuting hour. Los Angeles also has the most congested worst hour, with an average congestion delay of 69%. Austin ranked second worst at 55%, while San Francisco was third at 46%, Washington, DC fourth at 45% and New York fifth at 44%.

    Honolulu: Almost as Bad as Los Angeles: Smaller metropolitan areas also exhibited intense traffic congestion. Honolulu had an average congestion delay nearly as bad as Los Angeles, at 32.4% and a worst hour average congestion delay of 64%. The core urban area of Honolulu has the highest density of any metropolitan area between 500,000 and 1,000,000 population. New York exurb Bridgeport-Stamford had a worst hour average congestion delay of 63%, with a peak period average congestion delay of 18.0%.

    Inrix: Density and Traffic Congestion: Virtually all of the congestion and most of the analyzed road mileage is in the urban areas, rather than in the rural areas that make up the balance of the metropolitan areas. The metropolitan areas with more dense urban areas tend to have worse traffic congestion, as the table below indicates.

      • Metropolitan areas with core urban densities (see Note 1) of more than 4,000 per square mile had peak period average congestion delays of 18.4%, which is more than three times that of metropolitan areas with core urban densities of less than 2,000 (5.9%).

      • Metropolitan areas with core urban densities of more than 4,000 per square mile had worst peak hour average congestion delays of 37.5%, which is nearly 2.4 times that of metropolitan areas with core urban densities of less than 2,000 (15.9%).

    These relationships are similar to those indicated in the Texas Transportation Institute data for 2007.

    Traffic Congestion & Urban Density in the United States: 2009
    Core Urban Area Density (2000) Peak Period Average Congestion Delay: 2009 Compared to Least Dense Category Worst Hour Average Congestion Delay: 2009 Compared to Least Dense Category
    Over 4,000 18.4% 3.26 37.5% 2.36
    3,000-3,999 10.0% 1.76 22.3% 1.41
    2,000-2,999 7.3% 1.30 17.7% 1.12
    Under 2,000 5.6% 1.00 15.9% 1.00
    Density: Population per square mile
    Travel Time Tax: Additional travel time required due to traffic congestion
    2000 population density is the latest reliable data
    Calculated from INRIX & 2000 Census data

    Sierra Club Data Also Shows Nexus: Moreover, the association between higher densities and greater traffic congestion is indicated by the ICLEI-Local Governments for Sustainability Density-VMT Calculator, which is based upon Sierra Club research. According to the Calculator, under the “smart growth” scenario, residential housing would be 15 units per acre, as opposed to its “business as usual” scenario at a typical density of four housing units per acre. The density of traffic (vehicle miles per square mile) under the higher density “smart growth” strategy would be 2.5 times as high as under the “business as usual” scenario (Figure).

    The Inevitable Comparisons: Invariably, analysts (smart growth advocates and me) like to point out relationships between Portland, with its “smart growth” policies and Atlanta, the least dense major urban area in the world. The Inrix data shows Portland to have an average peak hour delay of 12.2%, which is 15% worse than Atlanta (10.6%). Portland is nearly twice as dense as Atlanta, while Atlanta’s traffic congestion is made worse by one of the most decrepit freeway and arterial systems in the nation.

    A National Vision: Inrix has also developed a monthly national congestion delay factor. Inrix notes that traffic congestion had been improving as driving declined due to the Great Recession. However, Inrix refers to reduction in driving as “lucky,” and notes that without a “national vision” that “includes addressing congestion as a national priority,” greater traffic congestion will result.

    There is indeed good reason to address traffic congestion. As David Hartgen and M. David Fields have shown, there is a strong relationship between the higher levels of mobility that occur with less congestion and greater economic growth. Obviously that relationship extends to higher urban densities, which are associated with economically counter-productive levels of traffic congestion.

    But there is more than jobs and the economy. More intense traffic congestion produces more intense air pollution as well as more greenhouse gas emissions. It is well to remember that public health was the rationale for air pollution regulation. Air pollution’s negative impacts are so local that they are measured in the quality of life of individual people, especially those in close proximity to unnecessarily overcrowded roads. It is ironic that the higher density promoted by smart growth advocates exposes urban residents to more intense air pollution.


    Note 1: 2000 core urban area (urbanized area) population densities are used in this analysis because there is no later reliable information. The next reliable urban area density data will be a product of the 2010 census. The Federal Highway Administration (FHWA) produces later urban area density figures, many of which are substantially inconsistent with those of the United States Bureau of the Census, which is the primary source of such information. For example, as late as 2005, FHWA reported the Houston urban area to have 1.3 million fewer people than the Bureau of the Census, while reporting a land area nearly 250 square miles larger than the census had measured. Of course, this is a physical impossibility. The result was that Houston’s density was overstated by 45%.

    Note 2: Inrix also ranks metropolitan areas using an “overall congestion” measure, which is simply all congestion added up. As a result, the overall congestion measure is heavily weighted by population. This is illustrated by comparing Los Angeles and Honolulu. These metropolitan areas have very similar average congestion delays, as noted above. This means that drivers encounter similar traffic delays during peak in Los Angeles and Honolulu. However, Honolulu’s overall congestion measure is 95% less than that of Los Angeles, principally driven by the fact that Honolulu’s population is 93% less. As such, the overall congestion measure is of little relevance to people in their day to day commute or as a comparative measure of the intensity of congestion between areas.

    Photograph: Los Angeles City Hall.

    Wendell Cox is a Visiting Professor, Conservatoire National des Arts et Metiers, Paris. He was born in Los Angeles and was appointed to three terms on the Los Angeles County Transportation Commission by Mayor Tom Bradley. He is the author of “War on the Dream: How Anti-Sprawl Policy Threatens the Quality of Life.

  • Norfolk Light Rail: Expensive Rising Tide

    The Virginian Pilot reports that the cost of the Hampton Roads (Virginia Beach-Norfolk metropolitan area) “Tide” light rail line has now escalated to nearly $340 million. This is up nearly one-half from the estimates made when the project was approved by the Federal Transit Administration. According to federal documentation, the line will carry 7,100 daily passengers in 2030. This means that the capital cost alone will amount to an annual subsidy of approximately $6,500 per daily passenger (using Office of Management and Budget discount rates), plus an unknown additional operating subsidy. This is enough to lease every daily commuter a new Ford Taurus for the life of the project (assumes a new car every 5 years and includes future car price inflation).

    The light rail line cannot be expected to do much for transportation. Even if the line reaches its projected ridership (many do not) by 2030, it will carry only 0.1% of the travel in the metropolitan area (one out of every 1,000 trips).

  • The Compelling Case For The Cable Car

    Say the words “cable car” and most people think of trolleys being towed up and down San Francisco’s hilly terrain. Most view them as a charmingly antiquated heritage system for the tourists, not as modern mass transit. But cable cars are making a comeback.

    Today, cable cars are one of a family of technologies collectively called Cable Propelled Transit (CPT). New generations of CPT not only include cable cars, but aerial trams, gondolas and funiculars as well.

    San Francisco cable cars, it should be noted, bare virtually no resemblance to these contemporary CPT systems, save for their basic method of propulsion. The technology used in San Francisco is roughly 120 years old, with little modernization. Wooden blocks pressed against the street are still used as brakes, and vehicles are manually operated.

    San Francisco cable cars are not so much cable transit as they are a living history of cable transit’s past. So why, then, is cable re-emerging as a technology of choice — preferred to buses, streetcars and light rail — to many public transit agencies around the world? Cities are discovering that cable’s inherent flexibility and adaptability gives it capabilities that no other transit technology shares. Adaptability, safety, reliability, price, environmental impact, speed, capacity, and a successful track record all contribute to these newfound positive impressions.

    The Innsbruck Hungerburgbahn, one of the world’s only Hybrid Funiculars. Image: Steven Dale.

    Yet despite cable’s growth in the last 10 years, the US transit industry is still largely ignorant about the technology. Ironic, considering the technology has a uniquely American history.
    Around 1890 there were roughly 500 miles of US cable car lines. While cable had been invented primarily as a means to ascend steep hills, the simple technology spread. Chicago, for instance, moved 27 million passengers per year. The system was a tremendous money-maker and the poster-boy for cable because – against all conventional wisdom – engineers had the chutzpah to install lines in one of the coldest, flattest cities in the country. A line in St. Paul, Minnesota was soon to follow.

    But by the turn-of-the-century, virtually all cable car systems had been converted to electrified streetcars, which at the time were more cost-effective and safer. Perhaps as a result of that legacy, more often than not today’s planners assume cable is a slow, expensive and dangerous technology, only useful in mountain regions for carrying a few skiers from one chalet to another. A 1989 study from the University of West Virginia confirmed this perspective, and it seems that perceptions haven’t changed much in the last 20 years.

    The Mandalay Bay Cable Liner is one of a new generation of cable cars that operate on light-weight elevated steel guideways. This system was installed in less than a year. Image: amitP at Flickr.com

    Here’s the real record:

    Popularity and Reliability: With the exception of San Francisco’s system, modern cable transit is not manually operated; it’s fully automated, which eliminates the cost of drivers and increases safety levels. This full automation offers the promise of unmatched reliability and efficiency levels; current systems boast reliable less-than-one-minute (LT1M) wait times between vehicles.

    This potential is key to the ridership level of any public transit system. According to the Transportation Research Board, wait times are 2.0 – 2.5 times more onerous to riders than actual in-vehicle time, and the reliability of those wait times is equally important. While most rail-based transit lines experience ridership that is half what was forecasted, cable tends to experience ridership above forecasts.

    The Perugia MiniMetro, every minute a 50 person vehicle arrives in the station. Vehicles travel above ground, below ground and at grade. Image: Steven Dale.

    Cost: CPT is cheap to build and maintain. The vehicles operate without engines, which drives down construction and maintenance costs. Cable transit systems can be built and maintained for a fraction of the cost of typical light rail systems.

    Safety: With the exception of elevators (which utilize the same basic technology), there are few public transit technologies with as good a safety record as cable. Over 10,000 cable installations operate worldwide, transporting billions of people per year, yet accidents are rare and fatalities are almost unheard of. The last known death associated with modern cable transit occurred in 2008 when a man fell from a gondola due to drunken horseplay.

    The Parque das Nações gondola in Lisbon demonstrates that cable isn’t just for mountains. Image: ricardo-pereira at Flickr.com

    Energy Efficiency: From an environmental standpoint, cable is in a class of its own. Due to its use of gravity and counter-balancing, it is not uncommon for maintenance workers to witness a cable system’s energy consumption drop below zero during peak loads. That is, the system itself can generate power.

    Speed: Cable transit can operate at speeds of up to 45 km/hr, well in excess of the average speeds of most traditional transit technologies. According to the American Public Transit Association, buses average approximately 20 km/hr; subways 33 km/hr; and light rail 24 km/hr. Average speed in urban public transit is dependent upon station spacing and right of way, not technology choice.

    The Portland Aerial Tram connects the Oregon Health Sciences University to the local transit grid. Image: dane brian at Flickr.com

    Capacity: Aerial cable transit systems can move up to 4,000 persons per hour per direction (pphpd) and ground-based systems can move up to10,000 pphpd. There is no single light rail line in all of North America that offers capacity greater than 3,700 pphpd and the average is less than 1,700.

    Adaptability / Flexibility: While it’s true that most cable installations cater to tourists, there is no reason to assume that they must. Similarly, just because most cable transit uses short line lengths, does not mean that the technology cannot be implemented over great distances. The technology is highly adaptable: while crossing rivers and climbing mountains are obvious applications, a system in Slovakia, for example, transports cars instead of people.

    The Vinpearl Island Gondola. The US$6 million dollar system links the Vietnamese mainland with the Vinpearl Island resort across 3 km of sea. The system is designed to withstand monsoons and earthquakes. Image: Jame at Flickr.com

    The Track Record: CPT is proven, unlike imagined but not-yet full-scale technologies like Personal Rapid Transit (PRT). Public transit systems in New York, Medellin, Caracas, Portland and Constantine, Algeria have all implemented aerial cable systems as fully-integrated components of their transit system. In addition, bottom-supported cable cars have found increased usage in airports, hotels and as full-scale public transit in Innsbruck and Perugia.

    A track record like that deserves attention.

    Steven Dale is the founder of Creative Urban Projects (CUP Projects), a boutique planning shop in Toronto, Canada. He is an expert on Cable-Propelled Transit with several years experience researching and consulting in the field. He recently launched The Gondola Project, an advocacy campaign in support of CPT. For more information, also visit Creative Urban Projects.

    Lead image: The Medellin MetroCable. The world’s first gondola system fully-integrated into a transit system. The initial line has been so successful, it has spawned an additional two lines in Medellin, Columbia. Image: il Castigliano at Flickr.com

  • The Transportation Community Braces for Continued Uncertainty

    Recent game changing events — notably, the Massachusetts election depriving the Senate Democrats of a filibuster-proof 60-vote majority, and the projected record breaking $1.6 trillion deficit in the FY 2011 budget proposal — have introduced serious uncertainties into the President’s domestic agenda. The federal surface transportation program is no exception.
    Even though this program traditionally has enjoyed bipartisan support it, too, is being buffeted by the shifting political winds. What follows is an assessment of the status and prospects of four legislative initiatives that bear directly on the future of the federal transportation program.

    The National Infrastructure Bank
    The National Infrastructure Bank (NIB) has been receiving a lot of attention lately. It was the subject of a January 20 press conference sponsored by the Building America’s Future coalition. It was endorsed in a Wall Street Journal op-ed by three members of the president’s Economic Recovery Advisory Board. And it was discussed by a panel of experts at a January 25 seminar on “Financing Public Works in Turbulent Times” sponsored by New York University. Responding to the multiple pleas, the White House included a modest $4 billion for the bank in its FY2011 budget request.

    The press conference featured a group of prominent long-time NIB advocates — Pennsylvania Gov. Ed Rendell, Senator Chris Dodd (D-CT), Rep. Rosa DeLauro (D-CT), former House Majority Leader Dick Gephardt and Ambassador Felix Rohatyn. Representatives of some 20 interest groups and trade associations provided a supporting cast. The speakers spoke eloquently about the need for greater infrastructure investment in America and how the National Infrastructure Bank could effectively serve that purpose. The Bank, they said, would fulfill three policy objectives: finance projects of regional and national importance, and create jobs and long-term economic growth. It also would serve as a vehicle for making better resource allocation decisions — based on merit rather than on pork barrel politics.

    The press conference failed to do, however, was to clarify some of the questions posed by critics of the NIB concept. Reason’s Robert has noted that if the NIB were set up “as a genuine bank, operated on commercial principles“, it would not able to fund a broad range of public infrastructure projects, some of which, such as schools, public housing and mass transit facilities which do not generate a revenue stream that could be used to repay the bank loans. Hence, the NIB would require periodic federal appropriations to cover grants for non-revenue producing projects. In that sense, it might turn out to be more like a foundation than a bank.

    There is little likelihood that Congress would be willing to turn the power of decision over large-scale capital projects to a new bureaucratic organization lodged in the Executive Branch. Many lawmakers, including the powerful chairman of the Senate Finance Committee, Sen. Max Baucus (D-MT), believe that Congress must not abdicate its authority over the spending of public capital. As one Senate aide remarked, one cannot “depoliticize” the project selection process, as NIB advocates would urge, because major public infrastructure investment decisions are inherently and fundamentally political in nature.

    The High Speed Rail Program
    The White House decision (announced on January 28) allocates the $8 billion in high-speed rail grants authorized in the Recovery Act to a total of 30 separate projects in 13 different rail corridors. Principal beneficiaries are the California High-Speed Rail Authority ($2.25 billion), the Florida Rail Enterprise and its 84-mile Tampa-Orlando high-speed line ($1.25 billion) and the Chicago-St. Louis rail corridor ($1.10 billion). The remainder of the money is spread around in amounts ranging from half a billion to as little as a few million dollars among 26 rail improvement projects in 31 states.

    Generally, high-speed rail advocates have been disappointed by the Administration’s selections because few of the projects offer the promise of true high-speed service — even the Florida project is not expected to attain European-like average high speeds. In contrast, the Administration’s decision to fund upgrades of rail infrastructure in as many as 13 different rail corridors makes good sense both in terms of politics and cost-effectiveness.

    True “high speed” service (as that term is used in Europe and the Far East, i.e. top speeds of 150 mph and higher) would require separating freight and passenger traffic. It would require building entirely new rail infrastructure in dedicated rights-of-way — something that is clearly not within the scope of a $8 billion program. The final price tag for California’s complete high-speed rail system could reach $60 to $80 billion and a recent Government Accountability Office report cites a range of construction costs for high-speed rail between $22 million/mile to $132 million/mile. From that perspective, the $8 billion looks like a drop in the bucket.

    In the meantime, with railroads expected to assume an ever growing share of intercity freight transport, upgrading infrastructure in existing rail corridors has become an urgent necessity. Since nearly all of Amtrak’s passenger trains run on rail lines owned by freight railroads, such improvements will also benefit passenger traffic. In most corridors, track and signaling upgrades on existing shared passenger/freight lines would permit raising speeds from today’s 60-80 mph to (0-100 mph, according to railroad experts.

    To be sure, a strong case can be made that true high-speed rail service will eventually be necessary between major city-pairs separated by less than 300 miles to relieve unacceptable levels of highway and air traffic congestion. But building a national network of dedicated high-speed rail lines from scratch will require decades of a sustained national commitment, spanning many administrations. There is no assurance that future presidents and future Congresses will share President Obama’s and Transportation Secretary LaHood’s enthusiasm for high-speed rail.

    Climate change legislation
    Chances of enacting tough greenhouse gas (GHG) emission reductions during this session of congress are remote. Senator Byron L. Dorgan (D-ND), Chairman of the Senate Energy Appropriations Subcommittee, has made it clear that a cap-and-trade bill, such as the giant House-passed Waxman-Markey bill, is “probably dead on arrival.” The prospects for a Senate compromise bill authored by Sens. John Kerry (D-MA), Joseph Lieberman (I-CT) and Lindsey Graham (R-SC) are also dubious at best.

    There are many factors that have contributed to the fading prospects for climate change legislation including disappointment over the inability of the Copenhagen Summit to reach a binding agreement to reduce carbon emissions. The revelations of ClimateGate, casting doubts on the integrity of some climate scientists’ objectivity as well as more recent disclosures about false claims of melting Himalayan glaciers have undermined the credibility of the UN Intergovernmental Panel on Climate Change (IPCC). Add to this the opposition of 14 Senate Democrats from coal-dependent states who fear that a cap on GHG emissions would raise energy costs and utility rates and growing public skepticism about the “consensus” over global warming and the future for any strong legislation seems murky. Indeed when the President in his the State of the Union address mentioned “the overwhelming scientific evidence” about global warming, it provoked muffled but clearly audible laughter among the assembled lawmakers.

    With the hopes of enacting a comprehensive cap-and-trade bill fading, attention is turning to energy initiatives that could launch the nation on the road to energy self-sufficiency and greener energy sources. Those prospects have brightened considerably since President Obama spoke of “building a new generation of safe, clean nuclear power plants” and “opening new offshore areas for oil and gas development” during his State of the Union address. However, the prospects for a more sweeping energy bill during this session of Congress remain in doubt.

    The Surface Transportation Reauthorization
    Finally, what of the oft-delayed multi-year surface transportation authorization? The responsibility for enacting this measure will very likely fall upon the shoulders of the next Congress. In the meantime, during the remainder of this year, the U.S. Department of Transportation may be expected to continue its series of “listening sessions” on how to reform the program and develop a vision that would merit broad stakeholder and congressional support. The Senate, for its part, is expected to launch its own process of legislative development. Sen. Barbara Boxer, Chairman of the Environment and Public Works Committee, has announced that her committee will begin drafting a multi-year authorization bill in March and will hold hearings later this year.

    Finding the revenue to support an ambitious multi-year bill will remain the overarching challenge facing reauthorization drafters in 2011. That new Congress may well be more tax-averse; the state of the economy and the price of oil will determine whether a hefty increase in the price of gas will be feasible. Until the question of funding is resolved, the transportation community will continue to live in a state of uncertainty, improvisation and a limited ability to plan ahead.

    Ken Orski has worked professionally in the field of transportation for over 30 years and is publisher of Innovation Briefs

    Photo: Center for Neighborhood Technology

  • Who’s Dependent on Cars? Try Mass Transit

    The Smart Growth movement has long demonstrated a keen understanding of the importance of rhetoric. Terms like livability, transportation choice, and even “smart growth” enable advocates to argue by assertion rather than by evidence. Smart Growth rhetoric thrives in a political culture that rewards the clever catchphrase over drab data analysis, but often fails to identify the risks for cities inherent in their war against “auto-dependency” and promotion of large-scale mass transit to boost the “sustainability” of communities.

    Yet in pursuing this transit-friendly future political leaders rarely confront this inescapable reality: public transportation is fiscally unsustainable and utterly dependent on the very car-drivers transit boosters so often excoriate. For example, a major source of funding for transit comes from taxes paid by motorists, which include principally fuel taxes but also sales taxes, registration fees and transportation grants. The amount of tax diversion varies from place to place, but whether the metro region is small or large the subsidies are significant. In Gainesville, Florida – a college town of 120,000 – the regional transit system received 80 percent of the city’s local option gas tax in 2008. In New York City, the Triborough Bridge and Tunnel Authority diverts 68 percent of its toll revenues to subways and buses.

    In addition to local subsidies, state and federal agencies fund transit operations with revenue from gas taxes and other motorist user fees. In 2007 transit agencies received $10.7 billion from the federal Highway Trust Fund, and that is a conservative figure since another $11.7 billion was diverted for vaguely phrased “non-highway purposes.”

    In contrast, fare box recovery doesn’t come close to covering operating expenses. Nor can transit pay for its own capital outlay. Last year the Metropolitan Washington Airports Authority moved to dedicate toll revenue and toll bonds to cover half the cost of the $5.26 billion Dulles Metrorail project.

    The implications of transit’s auto-dependency are serious. Americans drove 11 billion fewer miles between 2008 and 2009, and for each mile not traveled local, state, and federal taxes were not collected. Without these anticipated revenues, transit systems across the country have suffered and, ironically, those hit hardest are the people who are dependent on public transportation ,that is in most cities, the poor and the young.

    In D.C., transit riders are being warned by Metro officials to expect half-hour waits for buses and trains and more crowded rides as they cut services and lay off positions to close a $40 million budget shortfall. Santa Clara County’s Valley Transit Authority has announced plans to reduce bus service by 8 percent and light rail service by 6.5 percent. In Arizona, both Tempe and Phoenix face major cuts that will lengthen wait times and eliminate routes. Even as demand for transit increases in states like Minnesota, the decline in funding is leading to major readjustments in service.

    The situation is so dire in New York City – with by far the most extensive transit system in the country – that advocates used students as props to protest service cuts caused by a $400 million budget shortfall. Though transit receives funding from other sources, there can be no mistaking the key role played by motorists.

    The decline in driving can be attributed largely to the economic downturn and increased unemployment, but even when the recession ends transit agencies will face an uncertain funding future. New technologies are making automobiles cleaner and more fuel efficient, which will allow people to drive more while paying and polluting less. If auto makers meet new federal standards, cars will soon be achieving 35.5 miles per gallon instead of today’s 27.5 mpg average. Economic growth continues to disperse and there has been a strong uptick in telecommuting.

    But perhaps the biggest threat to the future of auto-dependent transit is the very “cause” that seeks to establish it as the preferred travel mode. The planning doctrine called Smart Growth with its rationale of sustainable development is growing in popularity in urban areas across the country. Local officials are enamored with visions of auto-light cities where the buses are full, sidewalks are crowded and there are more bicycles on the road than cars.

    Beneath the appealing rhetoric of Smart Growth rests the assumption that automobiles are intrinsically bad and that public policy should be directed at restricting their use. Rarely do policymakers weigh the automobile’s many benefits and the improving technologies that are mitigating its negative environmental impact. Even rarer is discussion of whether transit can realistically match the convenience and flexibility of the automobile for both individuals and families.

    Distracted perhaps by pictures of ornate transit hubs and shiny rail cars, many policy makers fail to focus on developing a fiscally sustainable plan for public transportation. They miss the fundamental problem that anything heavily subsidized –particularly in a budget constrained atmosphere – is, by definition, unsustainable. (To the extent roads are subsidized, it breaks down to about a half-penny per passenger mile; transit subsidies are 100 times more than driving subsidies.) Ideally, user fees would cover all expenses of all transportation modes, including driving.

    A responsible policy goal should be for transit users to put their fair share in the fare box. However, given the current tax diversion imbalance, local officials should at least target a near-term goal for fare box recovery of 85 percent of costs instead of its current one-third average. This will reduce both their fatal auto-dependency and the instability that comes when external revenue sources are impacted by external factors like an economic downturn.

    Transit agencies should also right-size their bus fleets. Despite visions of large 55-passenger vehicles filled to capacity with contented commuters, only a small portion of routes in any urban area can fill these big box buses even during certain peak times. A smaller sized fleet would be not only less expensive but also more flexible, allowing cities to adjust routes and increase headways for greater service. It would also have a smaller carbon footprint.

    Finally, responsible policymakers should suspend most of their plans to build rail transit. In addition to routinely running over-budget, rail transit- outside of a few cities such as Washington DC and New York- simply does not carry many passengers relative to automobiles to justify its enormous operating expenses . The Santa Clara Valley Transportation Authority, for example, spent $55.5 million in operating expenses in 2008, recovering just $8.6 million from passenger fares and costing taxpayers an average of $5.88 per trip.

    Rubber tire transit is more efficient compared to rail as a service to those needing public transportation. Santa Clara’s operating expenses per vehicle revenue mile were 25 percent less for bus than for light rail. Additionally, bus transit is far more flexible, easier to expand and less disruptive in the construction phase.

    Essentially, policymakers need to see transit as a service with an important but limited role to play in most urban regions. With jobs and more activities spreading to the suburbs and exurbs – a process often accelerated by economically disruptive urban policies, cities should focus transit on a limited number of central core commuters as well as those people who cannot drive. Unfortunately, such goals are too modest for planners who envision transit as the catalyst for large scale social engineering and who have little concern for their regions’ economic bottom line.

    The dirty little secret remains that public transportation would collapse without the automobile. It will remain unsustainable as long as it remains dependent on that which public policy is trying to discourage. Smart Growth rhetoric makes for great campaign literature but not for smart decision-making. Responsible officials should question the underlying assumptions about automobiles and begin reconsidering the fiscal calculus that underlies transit policy.

    Ed Braddy is the executive director of the American Dream Coalition, a non-profit public policy organization that examines transportation and land-use policies at the local level. The ADC’s annual conference will be held this year on June 10-12 in Orlando, Florida.

    Photo: ahockley

  • The Gero-Economy Revs Up

    Green jobs? Great. Gray jobs? Maybe an even better bet for the new jobs bill. If there is a single graphic that everyone concerned with the nation’s future should have tattooed on their eyeballs, my vote goes to the one on your left. Here is its central message:

    Forty years from now, one out of four Americans will be 65 or older.

    Twenty million will be over 85.

    One million will be over 100.

    So far the Big Think on such numbers might be boiled down to a few reasonable conclusions: People will have to work longer and delay retirement. The government should underwrite serial job retraining and promote new kinds of annuity plans. These will boost tax revenue that would help pay the nation’s growing Social Security and Medicare tab. “[It] would constitute a kind of neo-welfare state—a new covenant—that promotes individual responsibility in alliance with the voluntary sector, the market, and government,” observes Robert Butler, the dean of modern gerontology. He calls his package “productive aging.”

    But there is a third rung: incentives to make aging an engine of economic growth. There’s gelt in that there gray! It’s the entire world that’s aging, after all, and that world’s in need of gero-tools, gero-think, gero-innovation. We’ve got it. Let’s sell it – to China, Europe, India.

    I spent some time recently with innovators in this realm. Perhaps the most exciting were those designing new-style senior housing—ranging from high end architects and builders to small time real estate entrepreneurs. They are pursuing ways for the elderly to live more comfortably and safely in their own homes and communities.

    In Palo Alto, one former real estate saleswoman, frustrated with the elder-scary housing stock in that uptown realm, took to providing what turned out to be a popular and profitable service: gero-fitting, or “prostheticizing,” those ultra-modern (and hard-edged) homes with senior-friendly accoutrements: hand bars everywhere in case of a fall, showers and water sources that adjust heat and flow automatically, wheel chair turns in halls and room-by-room phones and computer screens that activate by voice.

    Nursing homes – places where one normally sees neither – are also slowly emerging out from under decades of under-investment and institution-think. Architects and developers from Sweden (one of the fastest aging nations in the world), Japan (the fastest in Asia) and even Italy (one of the most unprepared gero-nations) have been retooling the unfulfilled promise of universal design to come up with new construction methods and new construction materials.

    Yet it’s American builders, with their vast experience and regional flexibility, who stand to be generational leaders in the most profitable arena: building new homes. Where are they?

    Then there is transportation. Cars–and our addiction to them–are perennially painted as villains in elder-world. Yet until they are in their early 80s, aged drivers far outperform their younger counterparts, with fewer injury accidents and fewer tickets. Nevertheless, finding ways to make driving safer and more comfortable suggests another major opportunity: prostheticizing the automobile and making highways less cognitively confusing.

    Here in Los Angeles, the original car capital, one company is using space program sensor technologies to make cars that warn drivers when they are tailgating, when they are weaving, when their off ramp is coming up. Roadways? Someone needs to use our state-of-the-art understanding of cognition to redesign everything from highway signs to lighting. A few farsighted firms are already trying to do so. We need more.

    The aging of the modern stomach could also drive food science to develop new staples that are less glycemic (high blood sugar being one of the biggest sources of chronic inflammation in the elderly) but still tasty and satisfying. And, instead of being peremptorily dismissed, the “anti-aging” medical movement could be scientifically (and systematically) plumbed for real medical advances, tested with gold standard clinical trials, and then sold to the rest of the arthritic world.

    Who, then, will lead? Who will become the Bill Gates of ElderWare, the Al Gore of GeroWarming, the Warren Buffett of AlterAssets?. Right now, we’re still waiting.

    “The boomers are going to have a rougher time in retirement than their parents,” says Robert Butler. “That can mean two things: they can complain about it, or they can retool it for their kids and take advantage of its promise.”

    Greg Critser’s new book is Eternity Soup: Inside the Quest to End Aging (Random/Harmony 2010).