United States Secretary of Transportation Ray LaHood and Washington Post columnist George Will have been locked in debate over transit. Will called LaHood the “Secretary of Behavior Modification” for his policies intended to reduce car use, citing Portland’s strong transit and land use planning measures as a model for the nation. In turn, the Secretary defended the policies in a National Press Club speech and “upped the ante” by suggesting the policies are “a way to coerce people out of their cars.”
These are just the latest in a series of media accounts about Portland, usually claiming success for its policies that have favored transit over highway projects as well as its “progressive” land use policies. Portland has also become the poster child for those who advocate planning restrictions and subsidies favoring higher density development in parts of the urban core.
Indeed if Secretary LaHood has his way, Portland could become The Model for federal transportation policy. So perhaps it is appropriate to review what it has accomplished.
Portland’s Mediocre Results
Portland’s record of transit emphasis began more than 30 years ago, when the area “traded in” federal money that was available to build an east side freeway to build its first light rail line. The east side light rail opened in 1986. Since that time, Portland has significantly increased its transit service, especially opening three more light rail lines (West Side, North Side and Airport) as well as a downtown “streetcar.”
Portland’s Static Transit Market Share: With these new lines and expanded service, Portland has experienced a substantial increase in transit ridership. Passenger miles have increased more than 130 percent since 1985, the last year before the first light rail line was opened. This is an impressive figure.
However, over the same period, automobile use increased just as impressively. In 1985, approximately 2.1 percent of motorized travel in the Portland urban area was on transit and it remained 2.1 percent in 2007, the latest year for which data is available.
Portland’s Declining Transit Work Trip Market Share: One of transit’s two most important contributions to a community is providing an alternative to the automobile for the work trip (the other important contribution is mobility for low income citizens). Work trip rider attraction is important because much of this travel is during peak periods, when roadways are operating at or above full capacity. In 1980, the last year for which data is available before the first light rail line opened, United States Bureau of the Census data indicates that transit’s work trip market share was 9.5 percent in the Portland area counties of Clackamas, Multnomah and Washington covered by Portland’s strong land use policies. Yet despite this, and the transit improvements, the work trip market share has not grown. By 1990, transit’s market share had dropped a third, to 6.3 percent. It rose to 7.6 percent in 2000 and by 2007 had fallen back to 6.8, despite opening two new light rail lines since 2000 (Figure 1). Remarkably, transit’s 2007 work market share was 28 percent behind its 1980 share and had fallen 10 percent since 2000.
Figure 1:
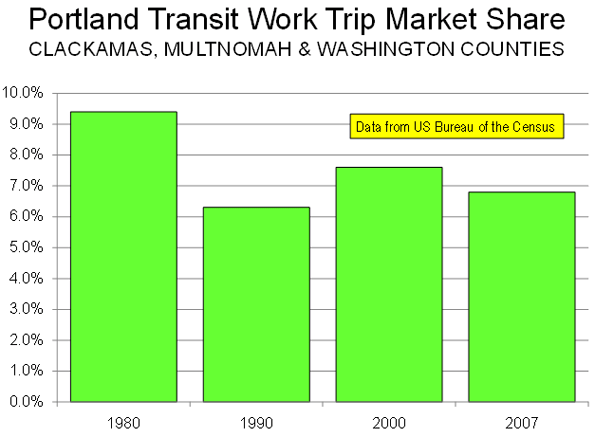
Yes, Portland did increase its transit use, but failed to increase the share of travel on transit and the proportion of people riding transit to work declined.
Driving the Portland Evangelism: GHG Emissions
Secretary LaHood’s affection for Portland appears to principally be that its policies can materially assist in the objective of reducing greenhouse gas (GHG) emissions. The data is available to test that claim.
We examined GHG emissions per capita by transit in Portland and the urban personal vehicle fleet, including cars and personal trucks (principally sport utility vehicles). Overall, including upstream emissions (such as refining and power production), transit in Portland is about 50 percent more GHG friendly per passenger mile than the 2007 vehicle fleet. If all of the increase in transit passenger miles from 1985 to 2007 replaced automobile passenger miles, then reduction of approximately 50,000 GHG tons can be said to have occurred as a result in 2007 (though as is indicated below, things are not that simple).
That sounds like a large number, until you consider that Portland traffic produces more than 8,000,000 GHG tons per year. Transit’s expansion has reduced GHG emissions by approximately 0.6 percent annually over 22 years. This pales in comparison to the 83 percent national reduction over a 45 year period that would be required by the Waxman-Markey bill being considered by Congress.
The Cost of GHG Emission Reduction
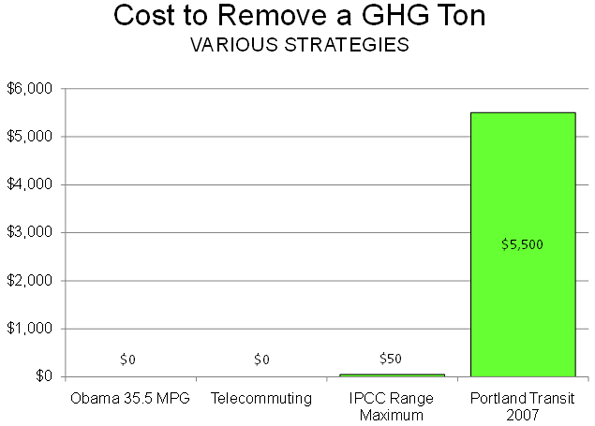
Moreover, GHG emission reduction requires a context. Not all GHG emission reduction strategies make sense. Given the widely held principle that GHG emission removal must not hobble the economy, it is crucial that costs (per ton of GHG removed) be a principal criteria. If excessively costly strategies are employed, the result will be wasted financial resources, which will translate into diminished economic growth and higher levels of poverty. According to the United Nations Intergovernmental Panel on Climate Change (IPCC), between $20 and $50 per ton is the maximum amount necessary to accomplish deep reversal of CO2 concentrations between 2030 and 2050. It is fair to characterize any amount above $50 per ton as wasteful and likely to impose unnecessary economic disruption.
Even that cost may be high. The current “market rate” is about $14 per ton, which appears to approximate the amount that figures such as former vice-president Al Gore, Speaker of the House Nancy Pelosi and California Governor Arnold Schwarzenegger pay to offset their GHG emissions from flying.
Portland Costs of GHG Emission Reduction
This $14 to $50 range provides the context for comparing the cost of GHG emission reduction through transit expansion in Portland. Annual transit costs in Portland more than tripled from 1985 to 2007 (including inflation adjusted operating costs and the annual capital costs of the light rail lines), an annual increase of more than $325 million. This figure is reduced to capture the consumer cost savings from reduced automobile gasoline and maintenance costs. The final result is a cost of approximately $5,500 per ton of GHG removed.
This is 110 times the IPCC $50 maximum and nearly 400 times the Gore-Pelosi-Schwarzenegger standard. If the United States were to spend as much to remove each ton of the likely 83 percent national reduction target, the cost would be $30 trillion annually, more than double the gross domestic product. To call the Portland GHG cost reduction figure extravagant would be an understatement.
Traffic Congestion Increases GHG Emissions
There is not a one-to-one relationship between reduced driving levels and reduced GHG emissions. As traffic congestion increases, urban travel speeds decline and “stop-and-start” traffic increases, fuel consumption is reduced (miles per gallon declines). Some or even all of the supposed gain from reduced driving can be negated by the higher GHGs from traveling in greater traffic congestion.
Portland’s traffic congestion has increased substantially since before light rail. Further, by 2007 Portland’s traffic congestion had become worse than average for a middle-sized urban area and worse than in much larger Dallas-Fort Worth, Atlanta, Philadelphia and Phoenix.
Further, according to information in the Texas Transportation Institute’s Annual Mobility Report, the amount of gasoline wasted due to peak period traffic congestion in Portland rose 18,000,000 gallons from 1985 to 2005 (latest data available, adjusted for the population increase), simply due to greater traffic congestion. The increase in GHG emissions from this excess fuel consumption is estimated to be approximately 200,000 tons annually. This is four times the estimated reduction in GHG emissions that was assumed to have occurred from the increase in transit ridership.
The bottom line: The Portland model inherently produces more congestion and increases GHG emissions. Failure to expand roadways to meet demand and forced densification increase traffic congestion.
Better Models
The ineffectiveness of Portland’s model strategies in GHG emission is in contrast to other strategies. Between 2000 and 2007, the share of people working at home in Portland rose more than one quarter. If transit and working at home should continue their 2000s rates, transit’s work trip share will be less than that of working at home by 2015. Working at home eliminates the work trip, resulting in substantial GHG emission reductions and does it at a cost of $0.00 per ton.
Another approach is the Obama Administration’s automobile fuel efficiency strategy. About the same time as the LaHood-Will debate was heating up, the President announced that automobile manufacturers would be required to increase their corporate average fuel efficiency for cars and light trucks to 35.5 miles per gallon by 2016, a 75 percent performance improvement from that of the present fleet. If this fuel efficiency could be achieved in Portland today, the reduction in GHG emissions would be more than 40 percent. This new policy would eventually close 90 percent of the gap between personal vehicles and transit in Portland.
President Obama indicated that this strategy is costless. The higher costs that consumers will pay for cars will be more than made up by the fuel cost savings. Thus, according to the President, this policy costs $0.00 per ton of GHG emissions removed, less than the IPCC’s $50 and less than Portland’s $5,500. Of course, it is not possible to achieve 35.5 miles per gallon now, but it will be (Figure 2).
Figure 2:
The best hybrid cars now achieve 50 miles per gallon, which makes them less GHG intensive than transit in Portland. President Obama has gone further, indicating the potential for developing 150 mile per gallon cars. The curtain could be rising on a future of cars that emit less GHG emissions per passenger mile than transit. People and officials genuinely concerned about GHG emissions should applaud these advances. On the other hand, people and officials who value coercive behavior modification more than GHG emission reduction are likely to resist.
The Consequences of Coercing People Out of Cars
Moreover, Portland policies ignore a crucial factor: how automobiles facilitate economic growth and employment. Generally, the research indicates that the economic performance of metropolitan areas is enhanced by greater mobility. Moreover, no transit system provides the extensive mobility made possible by the automobile, not in America and not even in Europe. Coercing people out of cars coerces some out of employment and into poverty.
Even where transit service is available, it generally takes longer than traveling by car. In 2007, travel to work by transit took 3:50 (three hours and 50 minutes) per week longer than driving in the nation’s largest metropolitan areas. With all of Portland’s transit improvements, it still takes approximately 3:15 longer per week to commute by transit than by driving. It appears that Secretary LaHood would add more than three hours (time many don’t have) to our work trip each week.
The Land Use Cost
The second plank of The Model is strong land use regulation (smart growth), which economic research shows to materially increase house costs, which would lead to a lower standard of living.
Time to Turn Off the Ideological Autopilot
The policies of The Model Portland have no serious potential for reducing GHG emissions and could even make it worse. On the other hand, the rapidly developing advances possible from improved vehicle technology, something the Administration espouses, show great promise. Behavior modification a la The Model turns out not only to be undesirable, but also unnecessary.
Wendell Cox is a Visiting Professor, Conservatoire National des Arts et Metiers, Paris. He was born in Los Angeles and was appointed to three terms on the Los Angeles County Transportation Commission by Mayor Tom Bradley. He is the author of “War on the Dream: How Anti-Sprawl Policy Threatens the Quality of Life. ”
”
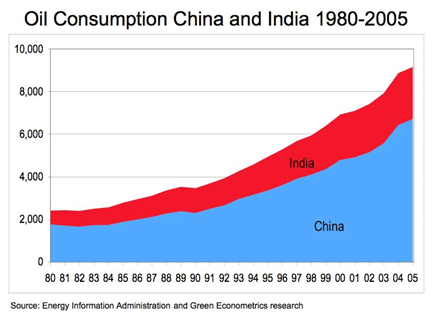
 We have previously reported on the development of a carbon neutral, single story 2,150 square foot
  About 200 million years ago the continents began to drift apart as the globe separated into eight distinct tectonic plates. History will record that the financial tectonic plates of our world began to drift apart in the fall of 2008. They have not stopped moving and the outcome of where they will end up remains uncertain.
 Fifty years ago General Motors owned more than 50% of the American market and automobile jobs made up one seventh of the US workforce. It was said that when GM sneezed the US economy caught a cold. GM shares now sell for less than a cup of coffee at Starbucks. Now GM is about to enter bankruptcy.
 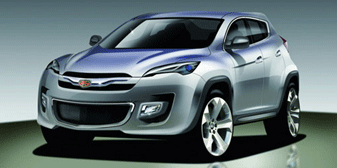 The New GM will become the platform for small fuel efficient cars, hybrids, electric vehicles and experimental technologies mandated by an ever demanding government. Its shareholders vanquished, The New GM will bear no resemblance to the car company that we have known for the last 50 years. Can the Chevy Volt rescue GM? The answer is no.