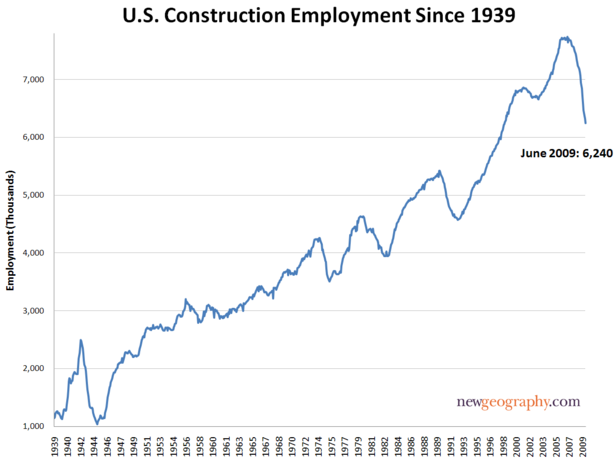
I recently looked at the changes in jobs in metro areas for 2012. Here’s a follow-on look at unemployment. First a look at the national unemployment rate picture, which has improved remarkably.
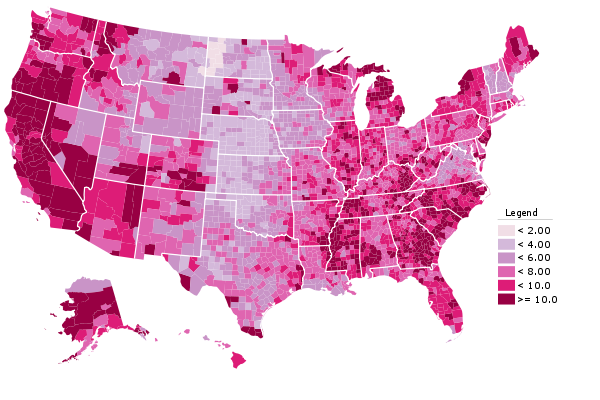
2012 Unemployment Rate by County
To put this in perspective, here’s the corresponding map for 2009:
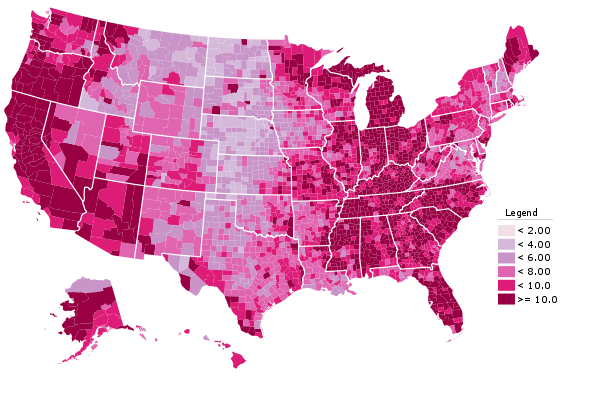
2009 Unemployment Rate by County
It’s interesting to see where there has been improvement versus where there hasn’t, though I stop thresholding at 10% so that if people we well above it but dropped to just merely above it, my maps wouldn’t show that improvement.
Here’s a look at the large metro areas, ranked by total decline in unemployment rate.
| Rank by Total Improvement | Metro Area | 2011 | 2012 | Total Change |
| 1 | Las Vegas-Paradise, NV | 13.5 | 11.2 | -2.3 |
| 2 | Orlando-Kissimmee-Sanford, FL | 10.2 | 8.4 | -1.8 |
| 3 | Tampa-St. Petersburg-Clearwater, FL | 10.6 | 8.8 | -1.8 |
| 4 | Miami-Fort Lauderdale-Pompano Beach, FL | 10.2 | 8.5 | -1.7 |
| 5 | Jacksonville, FL | 9.9 | 8.3 | -1.6 |
| 6 | Sacramento–Arden-Arcade–Roseville, CA | 11.9 | 10.4 | -1.5 |
| 7 | Birmingham-Hoover, AL | 7.9 | 6.4 | -1.5 |
| 8 | Cincinnati-Middletown, OH-KY-IN | 8.6 | 7.1 | -1.5 |
| 9 | Riverside-San Bernardino-Ontario, CA | 13.6 | 12.1 | -1.5 |
| 10 | Nashville-Davidson–Murfreesboro–Franklin, TN | 8.1 | 6.6 | -1.5 |
| 11 | Louisville/Jefferson County, KY-IN | 9.7 | 8.3 | -1.4 |
| 12 | San Jose-Sunnyvale-Santa Clara, CA | 10.0 | 8.6 | -1.4 |
| 13 | Columbus, OH | 7.5 | 6.1 | -1.4 |
| 14 | Kansas City, MO-KS | 8.0 | 6.6 | -1.4 |
| 15 | Houston-Sugar Land-Baytown, TX | 8.1 | 6.8 | -1.3 |
| 16 | Charlotte-Gastonia-Rock Hill, NC-SC | 10.8 | 9.5 | -1.3 |
| 17 | Seattle-Tacoma-Bellevue, WA | 8.7 | 7.4 | -1.3 |
| 18 | San Francisco-Oakland-Fremont, CA | 9.4 | 8.1 | -1.3 |
| 19 | Los Angeles-Long Beach-Santa Ana, CA | 11.4 | 10.1 | -1.3 |
| 20 | Salt Lake City, UT | 6.7 | 5.5 | -1.2 |
| 21 | Phoenix-Mesa-Glendale, AZ | 8.5 | 7.3 | -1.2 |
| 22 | St. Louis, MO-IL | 8.8 | 7.6 | -1.2 |
| 23 | Dallas-Fort Worth-Arlington, TX | 7.8 | 6.7 | -1.1 |
| 24 | San Diego-Carlsbad-San Marcos, CA | 10.0 | 8.9 | -1.1 |
| 25 | Detroit-Warren-Livonia, MI | 11.6 | 10.5 | -1.1 |
| 26 | Portland-Vancouver-Hillsboro, OR-WA | 9.3 | 8.2 | -1.1 |
| 27 | Atlanta-Sandy Springs-Marietta, GA | 9.8 | 8.8 | -1.0 |
| 28 | Austin-Round Rock-San Marcos, TX | 6.8 | 5.8 | -1.0 |
| 29 | San Antonio-New Braunfels, TX | 7.5 | 6.5 | -1.0 |
| 30 | Memphis, TN-MS-AR | 10.0 | 9.0 | -1.0 |
| 31 | Chicago-Joliet-Naperville, IL-IN-WI | 9.8 | 8.9 | -0.9 |
| 32 | Minneapolis-St. Paul-Bloomington, MN-WI | 6.3 | 5.5 | -0.8 |
| 33 | Raleigh-Cary, NC | 8.5 | 7.7 | -0.8 |
| 34 | Providence-Fall River-Warwick, RI-MA – Metro | 11.1 | 10.3 | -0.8 |
| 35 | Richmond, VA | 7.1 | 6.4 | -0.7 |
| 36 | New Orleans-Metairie-Kenner, LA | 7.2 | 6.5 | -0.7 |
| 37 | Cleveland-Elyria-Mentor, OH | 7.8 | 7.1 | -0.7 |
| 38 | Oklahoma City, OK | 5.5 | 4.8 | -0.7 |
| 39 | Denver-Aurora-Broomfield, CO | 8.6 | 7.9 | -0.7 |
| 40 | Hartford-West Hartford-East Hartford, CT – Metro | 9.0 | 8.4 | -0.6 |
| 41 | Milwaukee-Waukesha-West Allis, WI | 8.0 | 7.4 | -0.6 |
| 42 | Indianapolis-Carmel, IN | 8.4 | 7.8 | -0.6 |
| 43 | Baltimore-Towson, MD | 7.7 | 7.2 | -0.5 |
| 44 | Virginia Beach-Norfolk-Newport News, VA-NC | 7.1 | 6.6 | -0.5 |
| 45 | Boston-Cambridge-Quincy, MA-NH – Metro | 6.6 | 6.1 | -0.5 |
| 46 | Washington-Arlington-Alexandria, DC-VA-MD-WV | 6.0 | 5.6 | -0.4 |
| 47 | Philadelphia-Camden-Wilmington, PA-NJ-DE-MD | 8.6 | 8.6 | 0.0 |
| 48 | Pittsburgh, PA | 7.2 | 7.2 | 0.0 |
| 49 | New York-Northern New Jersey-Long Island, NY-NJ-PA | 8.6 | 8.8 | 0.2 |
| 50 | Rochester, NY | 7.8 | 8.1 | 0.3 |
| 51 | Buffalo-Niagara Falls, NY | 8.1 | 8.5 | 0.4 |