Tag: urban areas

  • A Bump in the Road to Chinese Urbanization?

    China has been urbanizing at a break-neck pace. Between 1980 and 2010, nearly China’s urban areas have added 450 million people, nearly 1.5 times the population of the United States. Nearly one-half (47%) of the nation’s population now lives in urban areas and the figure is expected to exceed 60% by 2030, according to United Nations data.

    According to The Asia Times, 230 million of these new residents are temporary migrants. They are people who have migrated from rural areas to take jobs in factories or other generally lower paid occupations. Under the nearly 60-year old Chinese residency permit system (“hukou”) citizens have either rural or urban residency rights. A principal purpose of this system was to limit the flow of rural residents to the urban areas.

    As Deng Xiaoping’s reforms took effect in the early 1980s, industrial production and exports skyrocketed and this required rural labor to migrate to the urban areas. Migrants were granted temporary status, but not permanent. It is possible, but difficult to transfer one’s hukou from rural to urban. Yet the demand for such transfers has been overwhelming.

    Yet, an article in the national newspaper, China Daily could mean a slowdown in the trend. The issue is the cost of living. Reporter Wang Yan notes that, for the first time, there is now a growing demand for transferring hukou residential status from urban to rural. There are currently no routine national procedures for such transfers.

    A survey of 120,000 temporary migrant workers in urban areas working by the Chinese Academy of Social Sciences research center found that only 25 percent would be interested in trading their rural residency permits for urban residency permits. The survey covered working age adults in 106 prefectures with large urban areas.

    The driving factor is economic. As in the United States, where differences in housing affordability are strongly associated with domestic migration trends, costly urban housing in China could be fueling a new attraction for rural areas. The cost of housing has risen substantially in China’s urban areas. At the same time, the cost of housing is near-zero in the rural areas. Further, residents of rural areas within prefectures with large urban areas have the hope of selling their land for urban development in the longer run and making a substantial profit. However, this new-found affection for the countryside is likely to be limited to areas relatively close to urban centers, to which rural residents can commute for better paying jobs.

    The government has announced plans to reform the hukou residency permit system. According to Zhang Yi, director of the Chinese Academy of Social Sciences research center is a system that “ensures freedom of migration.”

    The United Nations projections may be right. The stated preferences identified in the Chinese Academy of Social Sciences survey may not ultimately reveal themselves in actual behavior. But predictions are no more than predictions.

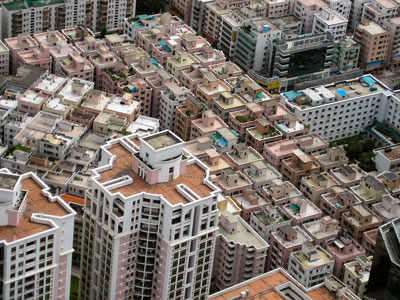
    Picture: Shenzhen: Luxury Housing (foreground) and Migrant Housing (background)

  • Special from Sydney: Misunderstanding Paris

    Reporters, columnists and even consultants often misunderstand urban areas and urban terms. The result can be absurd statements that compare the area in which the writer lives to somewhere else where the grass is inevitably greener, bringing to mind an expensive competitiveness report that suggested St. Louis should look to Cleveland as a model. Sometimes this is the result of just not understanding and other times it results from listening to itinerant missionaries from idealized areas who have no sense of the reality.

    A most recent example is from the Sydney Morning Herald, one of Australia’s largest and most respected newspapers.

    Columnist Elizabeth Farrelly told her readers that Paris covers one-quarter the land area (urban footprint) of Sydney and has a population of 5.5 million. In fact, the urban footprint of Paris is at least five times larger and the population nearly double.

    According to the Institut national de la statistique et des études économiques (INSEE), the statistics bureau of France, the urban footprint of Paris was 2,723 square kilometers in 1999 and the population in that area was 10,143,000 in 2006 (both figures are the latest data available).

    In contrast, according to the Australian Bureau of Statistics (ABS), the statistics bureau of Australia, the urban footprint of Sydney was 1,788 square kilometers in 2006. However, even the 50 percent larger urban footprint of Paris may actually understate the difference, because ABS uses a lower population density threshold than INSEE for urban versus rural classification. The difference between the two urban footprints is shown in the figure below.

    Ms. Farrelly also decried the continuing sprawl that she perceives in Sydney, despite the fact that no urban area in the new world, except perhaps Vancouver, has shut down home construction on its fringe to a greater degree (nor even has Paris). The effect of Sydney’s development Berlin Wall is housing affordability so bad that it is second only behind Vancouver out of nearly 275 metropolitan areas in the 6 nations we cover in the Demographia International Housing Affordability Survey.

  • How Much of the World is Covered by Cities?

    For years, planners and others have raised concerns about the amount of land that urbanization occupies, especially in the United States and other developed nations. My attention was recently drawn to an estimate that 2.7% of the world’s land (excluding Antarctica) is occupied by urban development. This estimate, which is perhaps the first of its kind in the world, is the product of the Columbia University Socioeconomic Data and Applications Center Gridded Population of the World and the Global Rural-Urban Mapping Project (GRUMP) and would amount to 3.5 million square kilometers.

    While the scholars of Columbia are to be complimented for their ground breaking work, their estimate seems very high, especially in light of the fact that in the United States, with the world’s lowest density urban areas, only 2.6% of land is urbanized. Further, the data developed for our Demographia World Urban Areas and Population Projections would seem to suggest a significant overstatement of urbanization’s extent. Demographia World Urban Areas and Population Projections data are generally from national census authorities and examination of satellite photography.

    The GRUMP overestimation is illustrated by the following.

    GRUMP places the total of all urban extents in the United States at 754,000 square kilometers, more than three times the 240,000 square kilometers reported by the Bureau of the Census in 2000. This is despite the fact that GRUMP uses the same urbanization criteria as the Bureau of the Census. At the average GRUMP population density, most US urban areas would not even qualify as urban under the national standards used in countries such as the US, Canada, the UK and France.

    The overestimation can be illustrated by Cairo, which surrounded by desert land virtually devoid of urbanization. GRUMP places Cairo’s urban land area (“urban extent”) at 10,900 square kilometers. Cairo is well known among demographers as one of the world’s most dense urban areas. Yet the GRUMP urban density, at 1,550 per square kilometer would make Cairo no more dense than Fresno, though somewhat more dense than Portland. The Demographia Cairo urban area is estimated at 1,700 square kilometers, more than 80% smaller. The contrast between the GRUMP and Demographia land area estimates is illustrated in the figure. There are a numerous additional discrepancies of similar scope.


    One problem with the GRUMP estimates is their reliance on lights at night as observed from satellites. The problem is that lights illuminate large areas and any estimates based upon them would be likely to be inflated. Documentation associated with GRUMP acknowledges this effect, which it refers to as “blooming.”

    But “blooming” is not the only problem. The poorest urban areas tend to have fewer lights and are thus illuminated to a larger degree than more affluent areas. The result, in the GRUMP data is that some of the project’s most dense urban areas are in fact not the world’s most dense. For example, low income Kinshasa (former Leopoldville), in the Democratic Republic of the Congo is indicated by GRUMP to be 40% more dense than Hong Kong. The reality is that Hong Kong is twice the density of Kinshasa, the difference being the effect of “blooming,” combined with more sparse electricity consumption in the African urban area.

    Demographia World Urban Areas and Population Projections accounts for more than 50% of world urbanization and includes all identified urban areas with 500,000 population or more. These urban areas cover only 0.3% of the world’s land area. There is only the most limited data for smaller urban areas. However, it is generally known that smaller urban areas tend to be less dense than larger urban areas (which makes one wonder why the anti-sprawl interests have targeted larger urban areas). In the United States, the urban areas with less than 500,000 population average about one-half the density of larger urban areas. University of Avignon data indicates that the smaller urban areas of western Europe are about 60% less dense than the larger ones.

    If it the US 50% less factor is assumed, then urbanization would cover approximately 0.85% of the world’s land (1.1 million square kilometers).

    If the European 60% less factor is assumed, then urbanization would cover 1% of the world’s land (1.3 million square kilometers).

    By these estimates, the GRUMP urbanization estimates would be more than 200% high.

    GRUMP has contributed a useful term to the parlance of urban geography — the “urban extent.” An urban extent is simply continuous urbanization, without regard to labor markets or economic ties. For example,

    The Tokyo urban extent might be considered to run from the southern Kobe suburbs, through the balance of the Osaka-Kobe-Kyoto urban area, Otsu, Nagoya, Hamamatsu, Shizuoka and through the Tokyo urban area to the northern suburbs, a distance of 425 miles (GRUMP calls the Tokyo urban extent the world’s largest).

    China’s Pearl River Delta, with its physically connected but relatively economically disconnected, urban areas (including at least Hong Kong, Shenzhen, Dongguan, Guanzhou-Foshan, Zhongshan, Jiangmen, Zhuhai and Macao) is another example.

    Despite its difficulties, the GRUMP project is an important advance and it is to be hoped will produce more accurate estimates in the future.


    Note: The Demographia Cairo urban area is also the urban extent (the extent of continuous urban development). It includes the 6th of October new town and New Cairo, but excludes the 10th of Ramadan new town, which is physically disconnected from the Cairo urban extent.

    Photograph: In the GRUMP Cairo Urban Area (by the author)

  • Dhaka’s Dangerous Development

    It has been a horrendous week in Dhaka, the capital of Bangladesh and the world’s most dense urban area (104,000 population per square mile/40,000 per square kilometer). On Tuesday, a five story residential building collapsed, killing 23 people in the building and in other structures in the path of the collapse. Then, on Thursday evening, a fire started on the lower floors of an 8-story residential building in the old town section of Dhaka. By the time it was controlled, 117 people had died and 8 buildings had been destroyed (link to Daily Star photo).

    Disastrous fires are an unfortunate fact of life in the hyper-dense informal settlements (shantytowns) that pervade large urban areas in developing countries. In April, 7,000 people were left homeless in a Manila shantytown fire (photo), while the homes of 4,000 families were destroyed in another Manila fire just three weeks later.

    While Dhaka has no shortage of shantytowns, this was not a shantytown fire. The bigger risk is the sprawl of high rise buildings (5 stories to 20 or more), which are home to most of the people who do not live in shantytowns. The Daily Star now reports in an article entitled, “Filled-up, Full of Risk” that much of the land is “reclaimed” and “marshy” in Dhaka and not suitable for multi-story buildings. Recent heavy rains have made the situation worse, and at least three additional buildings have begun to tilt since Tuesday’s collapse.

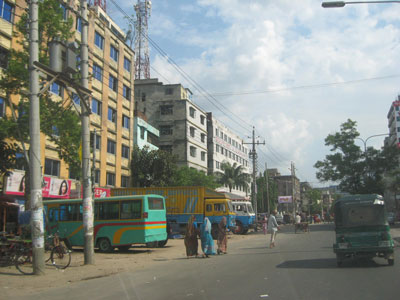
    Dhaka is built on one of the most challenging sites for an urban area. It sits on one of the world’s largest river deltas (the Ganges-Brahmaputra). The combined river course (called the Padma) is only miles to the west. Only 200 years ago, the Brahmaputra itself ran to the east of Dhaka and then changed course. This illustrates the instability of the riverine system, which completely surrounds the urban area with tributaries and river channels.

    A map produced in the Daily Star, illustrates the problem. The red areas are considered safe for building multi-story buildings. Virtually all of these areas are now developed. However, large sections of high rise buildings have been developed outside the red areas (see photo), especially between Mirpur and Gulshan. Virtually all of the areas that can be developed are unsuitable for high rises. With a population expected to rise from the current 10 million to 16 million by 2025, Dhaka needs room to grow. It will not be easy.

    Photo: Multi-story buildings between Mirpur and Gulshan

  • World Urban Areas and Population Projections

    Our colleague and frequent NewGeography contributor Wendell Cox of Demographia.com recently released the latest edition of his World Urban Areas and Population Projections publication.

    This 5th comprehensive edition includes:

    • Ranking of the largest world urban areas (over 2,000,000 population).
    • Population, urban land area and density estimates for all 763 identified urban areas with more than 500,000 population, comprising 49 percent of the world urban population.
    • Population, urban land area and density estimates for 1,370 urban areas of all sizes, comprising 53 percent of the world urban population.
    • Population projections for the world’s largest urban areas in 2025 & 2030 (over 2,000,000 population).
    • Summary of United Nations world population projections and summary by gross domestic product, purchasing power parity (from 4th Edition)
    • Charts on urban density and prosperity (from 2nd Edition)
    • Documentation

    Check it out.

  • When The City You Love Starts To Scare You

    Colin McEnroe’s piece in the Hartford Courant is a frightening tale about the indifference of the police to crime when it becomes so commonplace. A two hour wait for a call about a burglary. “I live in Gotham City, but there’s no Batman.”