Tag: Washington DC

  • Eros Triumphs…At Least in Some Places, Mapping Natural Population Increases

    As with other advanced capitalist societies, the US population is aging. About 30 percent of US counties experienced natural decrease – more deaths than births – in the 2000-2007 period.

    Nevertheless, the most exceptional feature of the United States remains its unusually high level of natural increase, and significant degree of population growth. This is often attributed to the high level of immigration, especially from Mexico, illegal as well as legal, and their high fertility. This process is indeed critical, even though most of the migration is in fact legal, and the share from Mexico is not as high as commonly perceived. Also most of the Hispanic population in the United States is native, not immigrant.

    Perhaps a more important feature of US society contributing to a smaller decline in fertility than in most other advanced countries is the extraordinary cultural traditionalism of perhaps half the American population. This is reflected in the so-called “culture wars”: a more educated modernism, pejoratively dubbed as “secular humanist,” versus a more traditional, religion-observing “moral majority.”

    Conservatives campaign against abortion and even contraception, and maintain an amazingly high level of religiosity and skepticism of science, creating a climate favorable to a level of fertility above replacement levels (2.1 per female). The super pro-child Mormon Church alone claims millions of members, and evangelical groups boast even more. This creates a fascinating, future-influencing tension between a younger-growing, more educated population choosing lower fertility on average, and a more traditional population more successful at reproducing themselves!

    Natural increase, then, can be expected in the following kinds of areas. One is heavily Hispanic areas. Those with more recent immigrant stock have higher fertility, but above replacement fertility seems to persist for several generations. Another lies in Native American Indian areas. The explanation here is controversial, but there is perhaps a sense of the need for more children as a reaction to a perceived threat of loss of identity.

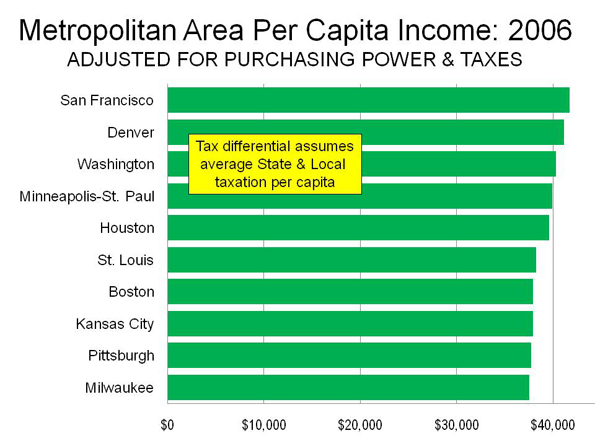
    For areas with more vibrant economic growth, attracting and maintaining young workers constitute another focal point for natural increase. These are overwhelmingly urban, even metropolitan. Note that these areas may not have above replacement fertility, but will have natural increase, simply because of the younger age structure of the population.

    Other strong candidates for natural increase include military base areas, because of the prevalence of young families. Likewise Mormon areas, and fundamentalist religion areas, at least where there remain sufficiently young populations.

    Seventy percent of counties had natural increase, differing from counties with natural decrease by higher immigration, much higher levels of urban population, a much younger population, and far higher levels of racial and ethnic minorities, especially Hispanics.

    A little more than half (1193) of counties with natural increase had net domestic out-migration – more people leaving than moving into the county, and of these the majority (702) lost population, while in the other 492 natural increase was greater than the out-migration loss, resulting in population gains. Out migration counties differ from in-migration counties ONLY because of the markedly higher ethnic and racial minority shares, obviously reflecting much weaker economic performances. The population losing counties had especially high African American population shares and were more rural.

    The net in-migration counties (1093) are usefully separated into those in which natural increase exceeded the net in-migration (only 272 counties) and those in which net in-migration was dominant (821). The former had slightly higher minority shares, and were somewhat more urban.

    Geography of Natural Increase

    Figure 1 maps natural increase by five levels, with cooler colors having a small natural increase (here in the simple sense of the excess of births over deaths as a share of the base population), and warm colors indicated high levels of natural increase. Rates of over 10 percent are really startlingly high.

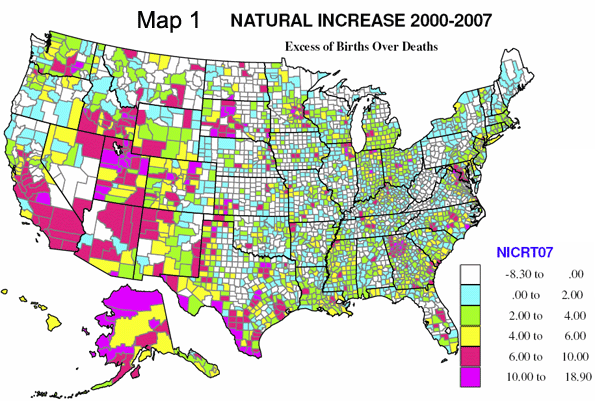
    Natural increase prevails over much of the country, with the exception of much of the Great Plains, from Texas to Canada, and northern Appalachia. High levels of natural increase, over 6 percent (orange and magenta on Map 1) occur in five kinds of areas that are really highly predictable.

    • First, areas of high Hispanic population, mainly from Texas to southern and central California, but also in parts of eastern Washington and southwestern Kansas.
    • Second, Native American Indian reservation areas, most obviously in Alaska, New Mexico, South Dakota, Arizona but also Montana and North Dakota.
    • Third, the Mormon “culture belt,” spreading from the “Zion” of Utah to Idaho, Nevada and Wyoming.
    • Fourth, rapidly growing suburban and exurban counties, most notably around Houston, Dallas, San Antonio, Austin, Atlanta, Washington DC, Chicago, Minneapolis, Charlotte and Denver, and
    • fifth, in counties with military bases, for example, in North Carolina, Georgia, Kansas, Oklahoma and several other states.

    Above average natural increase, from 4 to 6 percent, is typical of many modestly growing metropolitan areas, both central and suburban and exurban counties, and in a scattering of rural-small town counties, especially in the west (western Colorado is notable). Low natural increase, under 2 percent, is very widespread across both urban and rural areas, and is often indicative of slow-growing economies with out-migration (please see Map 2), and in areas moderately attractive to older migrants, thus depressing births, but not enough to cause natural decrease.

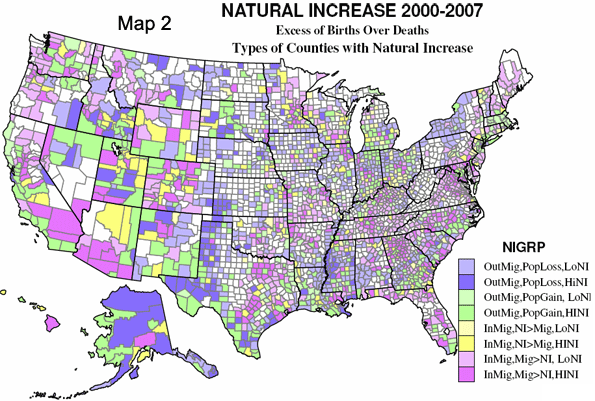
    Map 2 sorts counties according to in or out migration, population gain or loss, and the role of natural increase versus net in-migration. Four basic types are mapped, but then divided into high or low natural increase. Rapidly growing counties with net in-migration even greater than high natural increase (dark pink) are especially typical of suburban and exurban counties of large metropolises, and of fast-growing smaller metropolitan areas. Lower natural increase is more common for rural and small town amenity areas, as well as far exurban counties. Natural increase greater than in-migration (yellow) is not very common, and tends to occur in rural-small town counties, including several counties with high Mormon shares. Counties with out-migration but enough natural increase to permit overall population growth (green) are common in three kinds of areas. First are large central metropolitan counties – such as those containing Los Angeles, Houston, Dallas, and Miami – with high non-Hispanic white out-migration, but high Hispanic in-migration. The second type are border region counties with high Mexican in-migration, and the third are Native American Indian areas. Those counties experiencing population loss (purple) are much more like counties with natural decrease: dominantly rural or declining rust belt metropolitan areas.

    Finally, what areas have the highest rates of natural increase? These see increases of 16 to 19 percent from the base population. They are Wade-Hampton, Alaska (west of Bethel); Webb, Texas (Laredo); Utah (Provo); Hidalgo, Texas (McAllen); Loudoun, Virginia (Leesburg, northwest of Washington DC); Starr, Texas (Rio Grande City); and Madison, Idaho (Rexburg). Three are Hispanic, two Mormon, one Alaska native, and one fast growing suburban.

    Natural increase has remained higher than forecast 40 years ago due to far higher immigration, above replacement fertility even among the affluent and educated, and high teenage pregnancy in connection with constraints on abortion – i.e., America’s very high religious traditionalism. The unknowns ahead include the rate of future immigration, whether 2nd and 3rd generation Hispanics will reduce fertility markedly and whether education and modernism will reduce the power of tradition.

    See Richard’s similar piece on natural decreases in US population.

    Richard Morrill is Professor Emeritus of Geography and Environmental Studies, University of Washington. His research interests include: political geography (voting behavior, redistricting, local governance), population/demography/settlement/migration, urban geography and planning, urban transportation (i.e., old fashioned generalist)

  • Go to Middle America, Young Men & Women

    A few weeks ago, Eamon Moynihan reviewed economic research on cost of living by state in a newgeography.com article. The results may seem surprising, given that some of the states with the highest median incomes rated far lower once prices were taken into consideration. The dynamic extends to the nation’s 51 metropolitan areas with more than 1,000,000 population (See Table).

    There is a general perception that the most affluent metropolitan areas are on the east coast and the west coast. Indeed, 8 of the 10 metropolitan areas with the highest nominal per capita income in 2006 were on the two coasts. These included San Francisco, San Jose and Seattle on the west coast and Washington, Boston, New York, Hartford and Philadelphia on the east coast. Middle-America is represented by Denver and Minneapolis-St. Paul. However, as anyone who has lived on the coasts and Middle America knows, a dollar in New York or San Francisco does not buy nearly as much as a dollar in Dallas-Fort Worth or Cincinnati.

    Per Capita Income: Purchasing Power Parity
    US Metropolitan Areas over 1,000,000 Population
        2006 Per Capita Income  
    Rank Metroplitan Area Purchasing Power Adjusted Nominal Nominal Rank
    1 San Francisco $46,287 $57,747 1
    2 Washington $45,178 $51,868 3
    3 Denver $44,798 $44,691 8
    4 Minneapolis-St. Paul $44,326 $44,237 9
    5 Houston $42,815 $43,174 11
    6 Boston $42,571 $50,542 4
    7 Pittsburgh $41,716 $38,550 20
    8 St. Louis $41,613 $37,652 27
    9 Milwaukee $41,572 $39,536 19
    10 Baltimore $41,451 $43,026 12
    11 Seattle $41,448 $45,369 6
    12 Kansas City $41,329 $37,566 28
    13 Hartford $41,104 $44,835 7
    14 New Orleans $40,935 $40,211 16
    15 Philadelphia $40,725 $43,364 10
    16 Dallas-Fort Worth $40,643 $39,924 17
    17 Cleveland $39,997 $37,406 30
    18 Indianapolis $39,843 $37,735 26
    19 Chicago $39,752 $41,591 14
    20 Richmond $39,282 $38,233 22
    21 New York $39,201 $49,789 5
    22 Birmingham $39,057 $37,331 31
    23 Cincinnati $38,691 $36,650 36
    24 Nashville $38,680 $37,758 25
    25 Detroit $38,670 $38,119 24
    26 Charlotte $38,632 $38,164 23
    27 Miami $38,555 $40,737 15
    28 San Jose $38,505 $55,020 2
    29 Jacksonville $38,413 $37,519 29
    30 Louisville $38,262 $36,000 41
    31 Oklahoma City $38,156 $35,637 42
    32 Las Vegas $37,691 $38,281 21
    33 Salt Lake City $37,381 $35,145 45
    34 San Diego $37,358 $42,801 13
    35 Rochester $37,066 $36,179 38
    36 Columbus $37,058 $36,110 39
    37 Atlanta $36,691 $36,060 40
    38 Memphis $36,501 $35,470 44
    39 Tampa-St. Petersburg $36,260 $35,541 43
    40 Portland $36,131 $36,845 35
    41 Buffalo $36,091 $33,803 48
    42 Norfolk (Virginia Beach metropolitan area) $35,418 $34,858 46
    43 Raleigh $35,087 $37,221 32
    44 San Antonio $34,913 $32,810 50
    45 Providence $34,690 $37,040 34
    46 Austin $33,832 $36,328 37
    47 Phoenix $33,809 $34,215 47
    48 Sacramento $32,750 $37,078 33
    49 Los Angeles $32,544 $39,880 18
    50 Orlando $32,095 $33,092 49
    51 Riverside-San Bernardino $25,840 $27,936 51
    Source:        
    http://www.bea.gov/scb/pdf/2008/11%20November/1108_spotlight_parities.pdf

    Purchasing Power Parity: Things change rather dramatically when purchasing power is factored in. Some years ago, international economic organizations, such as the Organization for Economic Cooperation and Development, the World Bank and the International Monetary Fund began using costs of living by nation to compare national economic performance, rather than currency exchange rate. This practice, called “purchasing power parity” is based upon the recognition that there may be substantial differences in the cost of living between nations.

    This can be illustrated by comparing Switzerland and the United States. For years, Switzerland has had a higher per capita GDP than the United States on an exchange rate basis. Switzerland’s gross domestic product per capita was $53,300 in 2006, nearly 30% above that of the United States ($42,000). However price levels in Switzerland are so high that incomes do not go nearly as far as the exchange rate would suggest. Once adjusted for purchasing power parity, the Swiss GDP per capita in 2006 drops to $39,000, well below that of the United States. Much of the difference has to do with regulation. The more liberal economy of the United States produces a lower cost economy than in Switzerland, or for that matter most of Western Europe. The US economic advantage would be even greater measured on a household basis, since US households include nearly 10% more members (generally children) than those in Western Europe.

    The same concept was applied by the Department of Commerce Bureau of Economic Analysis researchers in their review of purchasing power parities between US metropolitan areas in 2006. When purchasing power is factored in, five of the top metropolitan areas in nominal per capita income (not adjusted for purchasing power) drop out and are replaced by other metropolitan areas rarely thought of as among the nation’s most affluent.

    Among the three west coast nominal leaders, San Francisco remains as #1, in both nominal and purchasing power adjusted per capita income. Seattle dropped from 6th to 11th position. However, the real surprise is San Jose, which dropped from 2nd position to 28th.

    The east coast regions ranked among the top 10 metropolitan areas in nominal income also were decimated by their high costs, with only Washington (which rose from 3rd to 2nd) and Boston (which fell from 4th to 6th) remaining. New York fell from 5th to 21st, Hartford from 7th to 13th and Philadelphia from 10th to 16th.

    The two non-coastal metropolitan areas in the nominal top 10 remain, with Denver rising from to 3rd and Minneapolis-St. Paul rising from 9th to 4th.

    It can be argued that Middle-America replaced the five metropolitan areas dropping out of the top ten. Houston, long one of the most disparaged metropolitan areas among urbanists, occupies the 5th position (compared to its 11th ranking in the nominal list). Three of the new entrants are confirmed members of the Rust Belt: Pittsburgh (7th), St. Louis (8th) and Milwaukee (9th). Finally, there is a new east coast entrant, blue-collar Baltimore (10th).

    The Impact of Taxes: But that is just the beginning. Taxes also diminish the purchasing power of households. Unfortunately, there is virtually no readily available information on state and local taxation by metropolitan area. There is, however state and local government taxation data at the state level. If it is assumed that this data is representative of metropolitan differences (weighted proportionately by state in multi-state metropolitan areas), there would be changes in rank among the top 10. Denver would displace Washington in the number two position, closing more than one-half the gap with San Francisco. Even more surprisingly, St. Louis would move ahead of both Boston and Pittsburgh to rank 6th. Kansas City would leap over #11 Seattle, Baltimore, Milwaukee and Pittsburgh to rank 8th, trailing #7 Boston by $25, not much more than the price of a Red Sox standing room ticket. Pittsburgh would occupy the #9 position and Milwaukee #10 (See Figure).

    More than Housing: The largest differences in purchasing power stem from housing, with east coast and west coast metropolitan areas having generally higher housing costs. As a result of the housing bust and the larger house price drops in those areas, purchasing power adjusted incomes could recover relative to those of Middle America. However, the high cost of living on the east and west coasts extend to more than housing prices. Generally, according to proprietary (and for sale) ACCRA cost of living data, the west coast and east coast metropolitan areas have higher costs of living even without housing. These differences are largely in grocery costs, which probably reflects the anti-big box store planning regulations and politics that exist in many of these areas. Grocery costs in the more affluent middle-American metropolitan areas tend to be lower.

    Other Surprises: Outside the top 10 most affluent metropolitan areas, there are other surprises. Urban planning favorite Portland ranks 40th, just above Buffalo. Rust Belt Cleveland ranks 17th, a few positions above New York. Kansas City, with its highly decentralized civic architecture, ranks 12th, just behind Seattle. Indianapolis (17th) is more affluent than Chicago (18th) and both are more affluent than New York.

    Five of the bottom 10 metropolitan areas are in the south, including Virginia Beach, Raleigh, Austin, San Antonio and Orlando. But perhaps the biggest surprise of all is that four of the five lowest ranking metropolitan areas are in the southwest: Phoenix (47th), Sacramento (48th), Los Angeles (49th) and Riverside-San Bernardino (51st).

    The Dominance of Middle America: But among the 10 most affluent metropolitan areas in the nation, six or seven may be counted as Middle-America (depending on how Baltimore is classified). Only three are from the original group that supplies 8 of the top metropolitan areas when purchasing power is not considered.


    Related articles:
    Gross Domestic Product per Capita, PPP: World Metropolitan Regions
    Gross Domestic Product per Capita, PPP: China Metropolitan Regions

    Photograph: Pittsburgh

    Wendell Cox is a Visiting Professor, Conservatoire National des Arts et Metiers, Paris. He was born in Los Angeles and was appointed to three terms on the Los Angeles County Transportation Commission by Mayor Tom Bradley. He is the author of “War on the Dream: How Anti-Sprawl Policy Threatens the Quality of Life.

  • Baseball Goes For Broke

    Other than the banking business, is there an industry more dependent on government handouts, sweetheart tax breaks, and accounting gimmicks than major league baseball?

    What other than a baseball depletion allowance explains the economics of a team like the New York Yankees, which is paying Alex Rodriguez $275 million over ten years while building a new $1.3 billion stadium and charging front row season tickets holders $800,000 for a box of four seats?

    If the rules of baseball included free enterprise, the Yankees would be playing on a diamond in Central Park, and skyboxes (which would not be deductible business expenses) would be limited to nearby apartment buildings.

    What accounts for all the growth in baseball economics — the salaries, the extortionate ticket prices, the new stadiums — is that the game varies little from some nineteenth century oligopoly trust, not unlike J.P. Morgan’s railroads or Andrew Carnegie’s steel mills.

    Let’s start with the basics: Since 1922, baseball has enjoyed anti-trust exemption, which means that league owners (best understood as robber barons) cannot move teams about willy-nilly. At the same time, the law makes it nearly impossible for competitors to establish rival competing franchises.

    The Yankees coughed up $1.3 billion for their new Yankee Stadium (of which local and state government are in for about $520 million) with the knowledge that neither the Royals nor the Pirates are allowed to move their home games to the Bronx or Brooklyn.

    The reason state and municipal governments — not just in New York, but all over the country — put taxpayer money into stadium white elephants is because voters identify more passionately with their professional teams than they do with their local politicians. Imagine the vote in New York if the choice was between Derek Jeter and Governor David Patterson?

    Just because modern baseball is fixed with more precision than the 1919 World Series was does not mean that the game (or at least a number of its teams) will not someday go bankrupt.

    Anti-trust exemptions, Tammany Hall municipal bond financings, and incestuous cable franchise awards may explain why teams like the New York Mets feel that they can spend $12 million a year on pitcher Oliver Perez. But it does not mean that they will be able to cover their obligations when the economy goes O-for-August (as once happened to Darryl Strawberry).

    To best understand baseball economics, think of the sport as similar to the investment banking business: a few large market firms (that have monopoly pricing power and cozy government relations) and then a lot of boutique establishments betting the franchise on some out-of-the-money option (Milton Bradley, Alfonso Soriano, and Alex Rios come to mind). The 2009 payroll for the Yankees is $201 million; for the Florida Marlins, it’s $36 million.

    To close the gap between rich and poor teams, municipalities from Philadelphia ($173 million) to Seattle ($392 million) have subsidized new stadiums, on the hope that sky-boxed, sellout crowds will allow team owners, usually mayoral pals, to pay for free agents. In turn, winning teams are to do for the local economy what the stimulus money may fail to achieve, namely, provide faith in the political system and interest cover for outstanding municipal bonds.

    Keep in mind that the baseball season is shorter than that for gladiolas. Many teams are out of the playoffs by July 4th, which means that the big, revenue-paying crowds must be attracted in the first three months of the season…when Kansas City fans still believe that they have a chance. Not long ago a double header between the Reds and Pirates started and ended with about seventy-five, yes that’s 75, fans in the stadium.

    Is it any wonder that the players union and many team managements, the Yankees included, turned a blind eye to steroids in order to pump up their products? In banking, executives went into sub-prime, hedge funds, and pyramid schemes to cover their bonuses. In baseball, the clear and the cream explain how the owners figured they would be able to afford the likes of Manny Ramirez.

    No one quite knows the precise debt figures of major league baseball, but the liability side of the balance sheet looks something like this: the league itself funds money-losing teams with a revolving line of credit, drawn against anticipated television rights. That’s like borrowing against next year’s equity in a house that has yet to be built.

    As for team debts, some franchises backload free agent contracts in order to defer liabilities until a new general manager may be on the job or the team has won a wild card game. Plus many teams have huge debts on new stadiums and skyrocketing payrolls. Even the Detroit Tigers, who play in a ghost town, run up $115 million per year.

    By my calculations, the Tigers would have to attract an average of about 40,000 fans per game, paying $35 a ticket, just to break even. In 2008, they averaged 25,000 fans a game, and I bet a lot of the unemployed autoworkers who attended didn’t pay $35 a ticket. Some of the debt service for the new Detroit stadium needs to be covered with casino money from an Indian reservation. (Pete Rose’s problem was that he played in casinos but did not own one.)

    To be sure, the plug figures in major league baseball’s finances are the local and national television contracts, not to mention the intramural luxury tax that has rich teams helping out the poor. National television revenue amounts to about $400 million per year, much of which is shared with the teams. That’s another attraction of anti-trust exemption; it limits supply. Why share the pie with, say, a hundred owners?

    Total revenue in the sport is about $6 billion, or an average of $200 million per major league team. Overall, baseball economics would work only if fans were prepared to spend $200 per game on warm beer and cold hot dogs, and renew cable television subscriptions to get games that have little meaning after July.

    The model is also predicated on the assumption that corporations can write off $800,000 in season ticket subscriptions, that the Internet does not blow away TV ads, and that Mariners fans will show up in September to watch their $99 million team wallow 10 games out of first place.

    If I had to bet on an MLB franchise going broke, my action would be on the Mets, who after all play in the House That Sub-prime Built, “Citi Field.”

    Not only did the owners, the Wilpon family, bet the ranch with Bernie Madoff, but they also spent $850 million on the new ballpark, and $25 million (over four years) on the likes of second baseman Luis Castillo. Attendance is down about 20 percent from 2008, and that’s before the team collapsed in the standings or bankrupt ex-Met Lenny Dykstra started sleeping in his car.

    Of course, baseball is no more exposed to the vagaries of the free market than is the banking business. Federally-funded banks, for example, can discount government-granted cable contracts, and pump money into the sport. Or a city like Washington can bailout another failing franchise, as it did with the Expos, and tax dollars can build a second $611 million stadium near the Potomac.

    Anti-trust exempted owners can even mothball a few teams (as they tried to do to the Twins a few years back), and boost the revenue share in that manner. Think of Commissioner Bud Selig’s office as a variant on the Texas Railroad Commission.

    Nevertheless, financial failure is nothing for baseball to dread. The only reason the Yankees could acquire Babe Ruth from the Red Sox in 1919 is because the Boston owner needed cash to invest in the Broadway show, “No, No, Nanette.” Maybe if they are squeezed, the Wilpons can swap Oliver Perez for some of their Madoff paper? At the very least they could get behind the sure hit, “Bye, Bye, Bernie.”

    Matthew Stevenson was born in New York, but has lived in Switzerland since 1991. He is the author of, among other books, Letters of Transit: Essays on Travel, History, Politics, and Family Life Abroad. His most recent book is An April Across America. In addition to their availability on Amazon, they can be ordered at Odysseus Books, or located toll-free at 1-800-345-6665. He may be contacted at matthewstevenson@sunrise.ch.

  • Rome Vs. Gotham

    Urban politicians have widely embraced the current concentration of power in Washington, but they may soon regret the trend they now so actively champion. The great protean tradition of American urbanism – with scores of competing economic centers – is giving way to a new Romanism, in which all power and decisions devolve down to the imperial core.

    This is big stuff, perhaps even more important than the health care debate. The consequence could be a loss of local control, weakening the ability of cities to respond to new challenges in the coming decades.

    The Obama administration’s aggressive federal regulatory agenda, combined with the recession, has accelerated this process. As urban economies around the country lose jobs and revenues, the D.C. area is not merely experiencing “green shoots” but blossoming like lilies of the field.

    To be sure, the capital region has been growing fat on the rest of America for decades, but its staggering success amid the recession is remarkable. Take unemployment: Although the district itself has relatively high rates, unemployment in Virginia and Maryland – where most government-related workers live – has remained around 7% while the nation’s rate approaches 10%.

    The reason is obvious: an explosion of government amid a decline in the private sector. Factories may be closing in Michigan, tech jobs and farms may be disappearing in California, but the people who grease the skids of the ever-expanding federal machine seem to be doing just fine.

    This is most evident at the top of the job market. The capital region now boasts the healthiest technology employment picture in the nation. Virginia has the highest proportion of tech workers in the nation. Maryland ranks fifth, and the district itself is seventh.

    The area also continues to enjoy continued growth in the lucrative professional and business service jobs category. Over the past year, according to latest estimates by www.jobbait.com, the D.C. area was the only region in the nation to enjoy growth in this field.

    Signs of Washington’s ascent abound. The local real estate market appears to be on the mend even as others suffer continued strong declines in values and rising foreclosures. Hotel prices, dropping virtually everywhere else, look to be rising as well.

    Occupancy rates, falling in most places, actually increased during the first half of 2009, as did revenues, which have taken a nosedive elsewhere. In New York prices have plunged – even the mighty Waldorf has been slashing rates.

    In many ways, the economic disasters in New York and other cities have proved a boon for Washington. Wall Street’s demise, for example, has been D.C.’s gain as the locus of financial power leaves New York for the Treasury, Fed, White House and the finance-related congressional committees. K Street is the new Wall Street, where you play for the really big stakes.

    This shift may soon spread beyond the financial sector. Want to get into the energy business? You can bypass Houston and head to the Energy Department and Environmental Protection Agency – they are the ones handing out subsidies and grants to “deserving” applicants. Thinking of expanding your city to accommodate new middle-class families? The people at the Departments of Transportation and Housing and Urban Development have their own ideas on how your cities and regions should grow.

    Manufacturing might be important to your economy, but Washington – a region with virtually no history of productive industry – generally regards factories as polluters, greenhouse gas emitters and labor exploiters. If you have enough lobbyists you might be able to hang on, but don’t really expect much in the way of positive help.

    Some “progressives” may like this model – after all, it originated in Europe, the supposed fount of all that is enlightened. Since the 18th century, Europe’s urban history has been largely dominated by great imperial centers – London, Paris, Moscow and Berlin – that treat other cities like something akin to poor relations.

    Even today European cities and localities tend to have far less control over their destiny than in the U.S. Zoning, planning decisions and even economic strategy often originate from the center, as does the power to tax and spend. For decades, Europe’s legacy of ancient urban privilege – so critical in emerging out of the dark ages – has ebbed before the increasing power of the national capitals. More recently the super-capital of Brussels, like Washington, thrives in hard times that are decimating other European urban economies.

    The great European capitals rose largely because they also served as the domicile of princes, bureaucrats and, until recent times, the clerical establishment. Other cities might have enjoyed a boom – such as Manchester during the industrial revolution – but, ultimately, hierarchy served to concentrate power in the great capital cities.

    In contrast, American cities and communities traditionally have retained control over planning, development and other critical growth factors. Equally important, American cities, noted the great sociologist E. Digby Baltzell, were not dominated by aristocracy but were “heterogeneous from top to bottom.” Urban growth came primarily not by central design but as a result of the often ruthless schemes and lofty aspirations, often ruthlessly expressed, of local political and business leaders.

    For example, the quintessential American city, New York, started as a commercial venture. As early as the mid-17th century 18 languages were spoken on Manhattan Island (population of 1,000) and numerous faiths practiced. In early New Amsterdam, the counting house, not the church or any public building, stood as the most important civic building.

    Even after the Dutch were pushed out by the more powerful British military, the bustling island city – renamed New York – retained its fundamentally commercial character. It served briefly as the nation’s capital, but its power grew from its port and its immigrants. The city’s entrepreneurial spirit and social mobility startled many Europeans. As the French consul to New York complained in 1810, “The inhabitants…have in general no mind for anything but business. New York might be described as a permanent fair in which two-thirds of the population is constantly being replaced; where huge deals are being made, almost always with fictitious capital; and where luxury has reached alarming heights.”

    This entrepreneurial pattern also drove the growth of New York’s many competitors – first the great industrial cities such as Cleveland, Chicago and Detroit and, later, West Coast metropolises like Los Angeles, the San Francisco Bay area and Seattle. More recently, there has been a similar spectacular rise of formerly obscure places like Dallas, Houston, Atlanta and Miami.

    Through much of this time Washington barely registered among the ranks of American urban centers. Despite early expectations that Washington would become “the Rome of the New World,” it lagged behind other American cities through much of the 19th century. The city was widely reviled as a fetid, swampy place with atrocious cuisine – hog and hominy grits were its staples – that offered little in the way of commerce, industry or culture. Even its great buildings were compared to “the ruins of Roman grandeur.”

    The First World War, the Depression and then the Second World War each boosted Washington’s status but hardly into the first rank of cities. Few entrepreneurs were attracted to a city dominated by regulators, clerks and lawyers. The cultural center lay in New York and Boston – and later Los Angeles. The Bay Area, Massachusetts and later Texas evolved into the primary technological centers.

    Not until the 1960s did Washington begin to emerge as something like a traditional national capital, with a large permanent population of well-educated and cultured citizens as well as a robust economy based on the defense industry and the expanding welfare state.

    But the financial crisis of 2008 has set the stage for an unprecedented growth of the region, with a Democratic president and majority seemingly determined to expand federal mandates into every crevice of community life. There is an eagerness to use federal authority in unprecedented ways that could bring federal influence into virtually every minute decision made in an urban area.

    This concentration of power is also bad news for urban economies, including New York’s. As New York University’s Mitchell Moss has observed, Gotham may be losing its perch as the true national financial center. But other cities also should take note of the trend. Polycentric sprawling cities like Los Angeles, Dallas, Houston, Phoenix and Atlanta soon may find themselves forced to reorganize themselves along lines preferred by federal urban “experts.” Hard-pressed industrial cities may find new environmental restrictions on ports and other key infrastructures an impediment to a much-needed renaissance.

    American cities are at a critical moment. Our competitive, commercial urban tradition certainly has its flaws, but it also has produced the advanced world’s most dynamic roster of modern cities and regions. Ceding the power of urban planning to Washington will cripple the American city – except, of course, for the one that reigns as locale for imperial control.

    This article originally appeared at Forbes.

    Joel Kotkin is executive editor of NewGeography.com and is a presidential fellow in urban futures at Chapman University. He is author of The City: A Global History. His next book, The Next Hundred Million: America in 2050, will be published by Penguin early next year.

  • Tracking Business Services: Best And Worst Cities For High-Paying Jobs

    Media coverage of America’s best jobs usually focuses on blue-collar sectors, like manufacturing, or elite ones, such as finance or technology. But if you’re seeking high-wage employment, your best bet lies in the massive “business and professional services” sector.

    This unsung division of the economy is basically a mirror of any and all productive industry. It includes everything from human resources and administration to technical and scientific positions, as well as accounting, legal and architectural firms.

    Overall there are roughly 17 million professional and business services jobs, 4 million more than manufacturing. This makes it twice as big as the finance sector and five times the size of the much-ballyhooed tech sector. While its average salary – roughly $55,000 a year – is somewhat lower than in those other elite sectors, its wages are still higher than those in all the other large sectors, like health. The sector’s $1 trillion in total pay per year accounts for nearly 20% of all wages paid in the nation; finance and tech together only account for $812 billion.

    More than that, the business and professional services sector has encompassed the fastest-growing part of the high-wage economy. Employment in lower-wage sectors like education has also grown quickly. But employment in other sectors that pay their employees well, such as technology, has remained stagnant; jobs in some, such as manufacturing, have fallen sharply. Critically, the business services sector – particularly at the better-paying end – seems to have weathered the current recession better than these other high-wage sectors.

    The crucial question remains: In what regions is this critical economic cog booming? In a new analysis with my colleagues at the Praxis Strategy Group, we examined Bureau of Labor Statistics employment data for this sector, keeping an eye on trends over both the last year and the last decade. Some of the metropolitan areas that boasted short-term growth in this sector also maintained steady employment success over the long-term, which suggests that these particular cities have sturdy economies that aren’t as prone to intense boom-bust cycles.

    At the top of our list of best places is greater Washington, D.C., and its surrounding suburbs in Virginia and Maryland. Government jobs may drive that economy, but it is the lawyers, consultants and technical services firms who harvest the richest benefits. As New York University public policy professor Mitchell Moss observes, Washington has emerged as the “real winner” in the recession – not just for public-sector workers but private-sector ones too.

    Fastest Growing Professional and Business Services Sectors
    Area Name Jobs in Sector 2009
    (thousands)
    Sector Share of Jobs 2009
    (percent of total)
    Growth 2008 – 2009
    (percent growth)
    Cumulative Growth 2001 – 2009
    (percent growth)
    2001-2009 Job Change (thousands) 2008-2009 Job Change (thousands)
    Northern Virginia, VA 355.2 27.2% 1.5% 22.4% 65.0 5.2
    Washington-Arlington-Alexandria, DC-VA-MD-WV 558.7 23.0% 0.9% 22.8% 103.6 5.1
    Austin-Round Rock, TX 112.4 14.4% 3.3% 18.7% 17.7 3.6
    Houston-Sugar Land-Baytown, TX 382.3 14.7% 0.9% 19.2% 61.5 3.2
    Virginia Beach-Norfolk-Newport News, VA-NC 106.6 14.0% 2.8% 8.0% 7.9 2.9
    Bethesda-Frederick-Rockville, MD 125.7 21.9% 2.1% 9.0% 10.4 2.6
    Wichita, KS 31.5 10.1% 3.5% 16.4% 4.4 1.1
    Chattanooga, TN-GA 25.9 10.6% 4.3% 11.8% 2.7 1.1
    Peoria, IL 23.0 12.1% 4.5% 43.2% 6.9 1.0
    Rochester, NY 61.8 11.9% 1.5% 1.9% 1.1 0.9
    Augusta-Richmond County, GA-SC 31.0 14.5% 3.0% 7.5% 2.2 0.9
    Mansfield, OH 5.1 9.1% 19.4% 4.1% 0.2 0.8
    Kennewick-Pasco-Richland, WA 20.8 22.2% 4.2% 20.2% 3.5 0.8
    St. Louis, MO-IL 195.4 14.6% 0.4% 3.9% 7.4 0.8
    Fayetteville-Springdale-Rogers, AR-MO 33.5 16.2% 2.2% 34.2% 8.5 0.7
    Macon, GA 12.1 11.9% 5.5% 31.2% 2.9 0.6
    Pittsburgh, PA 158.9 13.9% 0.4% 14.5% 20.1 0.6
    Fresno, CA 30.7 10.3% 1.9% 23.3% 5.8 0.6
    Provo-Orem, UT 23.3 12.4% 2.5% 16.7% 3.3 0.6
    Charleston-North Charleston-Summerville, SC 42.2 14.3% 1.3% 31.1% 10.0 0.5

    Over the past year, parts of northern Virginia – ground zero for the so-called “beltway bandits” who work in industries the government depends on to do its job – have enjoyed the fastest growth in business and professional services, adding over 5,200 jobs despite the current downturn.

    Other areas around the nation’s capital have also seen strong growth. The Washington D.C.-Arlington-Alexandria area, for example, came in second on our list, gaining nearly 5,100 positions, while No. 6 the Bethesda-Frederick-Rockville, Md., metro area added 2,600. In addition, yet another Virginia area – No. 5-ranked Virginia Beach-Norfolk-Newport News, a center for military-related industries – gained nearly 2,900 jobs in this sector.

    It’s far too early to thank the free-spending ways of Barack Obama’s administration for all this growth. As anyone can tell you, the Bush White House and its Republican Congress were not exactly models of fiscal restraint. Plus, Washington and Northern Virginia have seen growth in their business services sectors over the last several years, in the period stretching from 2001 to 2009. Together those two metros added over 165,000 new jobs in this critical, high-wage sector.

    Of course, you don’t have to head to Washington to find a high-paying job – although you might not be able to escape unpleasant summer weather. The other major group of business-services hot spots includes Austin, Texas, at No. 3, and Houston, at No. 4. These Lone Star local economies have continued to thrive not only during the current recession but also over the last decade.

    The others winners include farther-afield locales in Kansas, Tennessee, Illinois and New York. These areas could be gaining both from companies seeking to lower costs and from the new capabilities for remote work due to the Internet. Even though they didn’t make our list, a host of smaller communities – like Mansfield, Ohio; Provo, Utah; and Charleston, S.C. – also enjoyed significant growth in the business services sector over the past year.

    So if these are the places where this segment of the economy is growing and high-paying jobs are easier to come by, where is the opposite true? The worst cities on our list span three archetypes: Rust Belt basket cases, Sunbelt flame-outs and expensive big cities. Perhaps the toughest losses were in Michigan: Detroit and the Warren-Troy metro area suffered big setbacks both in the last year and over the last decade.

    Fastest Declining Professional and Business Services Sectors
    Area Name Jobs in Sector 2009
    (thousands)
    Sector Share of Jobs 2009
    (percent of total)
    Growth 2008 – 2009
    (percent growth)
    Cumulative Growth 2001 – 2009
    (percent growth)
    2001-2009 Job Change (thousands) 2008-2009 Job Change (thousands)
    Phoenix-Mesa-Scottsdale, AZ 289.2 16.0% -10.8% 7.9% 21.2 -35.1
    Warren-Troy-Farmington Hills, MI 202.5 18.5% -12.0% -21.2% -54.4 -27.7
    Chicago-Naperville-Joliet, IL 633.6 16.8% -4.1% -2.9% -19.0 -27.0
    Los Angeles-Long Beach-Glendale, CA 574.7 14.3% -4.2% -3.4% -20.4 -25.2
    Atlanta-Sandy Springs-Marietta, GA 390.3 16.4% -5.9% -1.3% -5.1 -24.4
    Orlando-Kissimmee, FL 170.9 16.2% -8.5% 7.7% 12.3 -16.0
    Santa Ana-Anaheim-Irvine, CA 261.9 18.0% -4.7% 4.0% 10.2 -12.8
    Minneapolis-St. Paul-Bloomington, MN-WI 253.4 14.4% -4.6% -4.6% -12.2 -12.3
    Edison-New Brunswick, NJ 164.5 16.3% -6.7% -2.6% -4.4 -11.9
    Detroit-Livonia-Dearborn, MI 108.9 14.7% -9.5% -20.9% -28.8 -11.4
    Indianapolis-Carmel, IN 120.3 13.4% -8.3% 13.6% 14.4 -10.8
    Riverside-San Bernardino-Ontario, CA 133.7 11.2% -6.5% 36.0% 35.4 -9.2
    Tampa-St. Petersburg-Clearwater, FL 223.2 18.5% -3.7% 12.3% 24.5 -8.6
    New York City, NY 595.7 15.8% -1.4% -0.8% -5.1 -8.4
    Newark-Union, NJ-PA 163.5 16.0% -4.7% -0.5% -0.8 -8.0
    Bergen-Hudson-Passaic, NJ 130.6 14.6% -5.8% -9.1% -13.0 -8.0
    Milwaukee-Waukesha-West Allis, WI 107.6 12.9% -6.6% -1.7% -1.8 -7.6
    Miami-Miami Beach-Kendall, FL 139.1 13.4% -4.7% 2.2% 3.0 -6.8
    Oakland-Fremont-Hayward, CA 158.0 15.6% -4.0% -7.1% -12.2 -6.7
    Las Vegas-Paradise, NV 108.2 12.1% -5.8% 38.1% 29.9 -6.6
    Boston-Cambridge-Quincy, MA 308.8 18.2% -2.0% -6.8% -22.5 -6.4
    Sacramento–Arden-Arcade–Roseville, CA 106.1 12.3% -5.6% -1.8% -1.9 -6.3
    Cleveland-Elyria-Mentor, OH 137.8 13.3% -4.3% -5.2% -7.6 -6.1
    Denver-Aurora-Broomfield, CO 207.0 16.9% -2.9% 4.0% 8.0 -6.1

    Consistent job losses in business services in these areas – some 54,000 in the Troy area since 2001 – reveal the clear connection between employment in business services and in the region’s fundamental auto industry. It turns out that elite services often prove dependent on basic industry. When industrial plants shut down, it’s not just blue-collar workers and company executives that suffer; as a result, these firms will use fewer lawyers, accountants, architects and technical consultants.

    A similar picture emerges in cities like Phoenix, which lost about 35,000 business-services jobs in just one year. This loss stems from the collapse of the housing bubble, which powered the rest of the regional economy. The same meltdown caused smaller but still significant reversals in one-time boomtowns like Orlando, Fla., Atlanta and Southern California’s Santa Ana region, which encompasses Orange County, where business service employment dropped by double-digit rates over the past year.

    Yet these same areas should see some recovery, perhaps more so than the traditional auto manufacturing-focused towns. Phoenix, Orlando and other Sun Belt locations – including a host of other areas in Florida – all saw increasing employment in business services over the past decade. If the economy comes back, along with a stabilization of the residential real estate market, business-services job growth will likely begin to take off again. After all, the fundamental reasons for the success of these areas, such as warm weather, lower costs and the need to serve a growing population, have not fundamentally changed.

    Perhaps most perplexing is the fate of some of the other places on our worst cities list, particularly the biggest metropolitan areas. The professional and business services sector is widely considered ideal for large, cosmopolitan centers, since lots of industries require support. But Chicago experienced a huge chunk of job losses – almost 25% – in this sector during the last year. Other big cities, including Los Angeles, Minneapolis and New York, also suffered.

    This is not a new phenomenon. These and other big cities, like Boston and San Jose, San Francisco and Oakland in California, have been shedding these types of jobs since 2001. These losses, however, have been concentrated at the lower-wage end of the business service pyramid, in areas like human resources and administration. These are the positions that companies can fill more easily and cheaply using the Internet or by hiring in less expensive outposts.

    That’s why Washington and its environs, which has seen across-the-board business growth, remain the great exception. Many business-services jobs outside the beltway appear to be becoming more nomadic, based in places where firms face lower costs and where workers can afford to live well on middle-income salaries. Even the long-term resiliency of higher-wage employment like law and accounting in traditional business hubs like New York could be at risk over time, with some jobs shifting to less expensive locales or even overseas.

    The changing nature of business services presents a boon to some communities and a challenge to others as they seek to survive and thrive in spite of the current recession. How some cities manage to grow this segment of their economies may well presage which parts of the country will thrive best during the years of recovery – and beyond.

    This article originally appeared at Forbes.

    Joel Kotkin is executive editor of NewGeography.com and is a presidential fellow in urban futures at Chapman University. He is author of The City: A Global History. His next book, The Next Hundred Million: America in 2050, will be published by Penguin early next year.

  • Washington, DC: The Real Winner in this Recession

    No matter how far the economy falters, there is always a winner. And no city does better when the nation is at the brink of disaster than Washington, DC. Since December 2007, when the current recession formally began, the nation has lost approximately 6 million jobs. Only two states, Alaska and North Dakota, have lost a smaller percentage of jobs than Washington, DC, which has seen a job loss of 0.6%, or 4,400. Simply put, Washington has done better in this recession than 48 of the fifty states when it comes to job performance.

    This is not the first time that Washington flourished while the rest of the nation suffered. For the first few, largely prosperous decades of the 19th Century, the district was a backwater, growing more slowly than the national average. It was widely reviled as fetid, swampy place with little in the way of commerce, industry or culture. Even its great buildings were compared to “the ruins of Roman grandeur.”

    It was only during arguably our greatest national tragedy – the Civil War – that the District of Columbia grew into an urban center, more than doubling in population from 1860 to 1870. Soldiers from the northern states flocked to the District of Columbia before going to battle, a new military force was established to guard against a Confederate attack, and the management of the war itself became a major federal enterprise. Slavery was abolished in Washington prior to emancipation, and freed slaves added to the District’s growing population.

    During the 1930s, FDR created an entirely new set of federal agencies designed to create jobs by financing projects across the country. At the same time, to prevent abuses on Wall Street, Congress created new regulatory agencies, such as the Securities and Exchange Commission, which hired droves of young accountants and lawyers unable to find work in other cities across the country.

    The Second World War and the Cold War also played to Washington’s advantage, as a vast military-industrial complex rose to the fore. So it’s not surprising that now, with the nation in the midst of its worst downturn since the Great Depression, that Washington appears about to indulge in yet another orgy of growth.

    Washington has always been a one industry town: that’s why it has an intrinsically self-absorbed monotonic culture. Everyone there depends on government for their livelihood. It is fundamentally not a city of competitive industries, but a giant taxpayer-funded office park, surrounded by museums and memorials. The great presidents: Washington, Lincoln, and Jefferson, have their own monuments, while more recent leaders have concert halls and office buildings named after them.

    Today Washington, DC appears much as the twenty-first century version of a gold mining town, even if the gold, so to speak, is coming from taxpayers as well as foreign buyers of our increasingly debased US currency. The Bush Administration kicked off this boom when it created the third largest cabinet department, the Department of Homeland Security, (by consolidating unrelated federal agencies into one super-sized department) and made it the employer of airport baggage and security inspectors across the nation. A new federal agency deserves a new headquarters, of course. DHS is now rising on the site of St. Elizabeth’s Hospital in southeast Washington DC, a pre-stimulus stimulus for the District of Columbia.

    The passage of the American Recovery and Reinvestment Act may be only slowly stimulating the nation’s economy but it is already working wonders in DC. Everyone wants a piece of the action. There is a surge in the lobbying industry, with every school board, regional transit agency and county government hiring a lobbyist to guide them through the new federal grant programs.

    Tourism may be temporarily down in DC, but the hotels are filled with local law enforcement officials, university bureaucrats, and housing advocates all trying to create jobs with federal dollars. The National Telecommunications and Information Administration and the US Department of Agriculture have just nineteen months to spend $4.7 billion on broadband communications.

    To evaluate the thousands of proposals for federal funding, expert panels will convene in Washington, DC. Where else? Communities across the country may receive grants, but the hotel and restaurant industry in the nation’s capital will also prosper from this new federal program.

    The same process will follow other Obama initiatives. Health care and climate change legislation will produce the same rounds of hearings, a growing cadre of regulators and the corps of tassel-shoed lobbyists who will try to influence them.

    The heightened emphasis on transparency in government has compelled every federal department to build sophisticated websites to engage the public, to distribute information, and to conduct the entire process of awarding grants and contracts. The demand for website designers and managers has grown so quickly that a Los Angeles-based interactive advertising agency, “Sensis,” a minority owned and operated corporation, recently opened an office in the District of Columbia just to “capitalize on the federal government’s new interest in digital communications.”

    There is one unambiguous measure that signals the growth of business activity within a city. Until recently, taxi fares in the nation’s capital were based on zones. These made it very inexpensive for members of Congress to go to and from the Capital. Today, every DC taxi has a meter and the old-fashioned zone-based system has been abolished. Both the municipal government and taxi drivers understand that there are more dollars to be made from those seeking to influence government than those who actually make the laws.

    Ben Smith of Politico.com has recently pointed out that five new Washington-based reality television shows are in the planning stages, with Bravo ready to launch “The Real Housewives of Washington, DC.” It is no accident that the entertainment industry has discovered the District of Columbia. A city that thrives in a recession may become the Fantasyland of our generation.

    Mitchell L. Moss is Henry Hart Rice Professor of Urban Policy and Planning at NYU Wagner School of Public Service.

  • The Chevy Chase Club: Real Estate And Racism

    A website that focuses on land use, and on urban and suburban design is a particularly appropriate forum in which to discuss country clubs – those large occupiers of choice real estate – and how the social structure of country club membership fosters, institutionalizes and perpetuates racial attitudes that are decades behind the attitudes reflected in all other elite American institutions.

    The racial bias pervading elite country clubs is back in the news today, as rumors grow that the country club set is angling to assert its power in the Republican party by dumping newly-elected RNC chief Michael Steele. Katon Dawson, the South Carolina Republican party leader, made a pro-forma “effort” (one letter in August 2008) to reform the racial bias of members of his own country club, which should fool no-one about whether he really cares enough about racial integration. Dawson is at the center of rumors reported in National Review On-line (which Dawson denies) that Steele may be dumped if Republicans fail in the March 31st special election to take the New York congressional seat vacated by Democrat Kirsten Gillibrand, appointed to fill Hillary Clinton’s US Senate seat.

    Fifty-five years after Brown v. Board of Education (1954), it seems that every private school, university, major law firm, and corporate board room in Washington, D.C., has made a genuine (though by no means complete) effort at racial integration. In our working lives, and our children’s school lives, we are more and more within an integrated environment that has moved beyond tokenism. So it is unsettling to set foot on the grounds of an elite country club, and enter a world that is as white as it would have been in the 1950s or, indeed, in the 1910s.

    I speak from experience. For four generations, my family have been members of the Chevy Chase Club, established in the late 1890s in Maryland just over the District line. As the club that sitting Chief Justice John Roberts chose to join (effective Sept. 2007), it has not only historical significance, it has current significance today, both in Washington, D.C. and in the nation as a whole.

    As described in The American Country Club, Its Origins and Development by James M. Mayo, the idea of the country club arose in connection with the development of the street-car systems that made possible the development of “street-car suburbs” in the late 1890s. Including a country club in connection with a housing development is a successful pattern that’s still used today to make new housing developments more attractive, by offering a center for golf and tennis, formal rooms in the clubhouse for wedding receptions and other gatherings, and restaurants for casual or formal dining.

    The problem arises because the suburbs, as conceived and developed in the 1890s, institutionalized racial segregation. At the time, successful efforts were underway — not just in the South, but in the North — to end the integrationist effects of Reconstruction and to enforce “Jim Crow.” The developer and first President of Chevy Chase Club was the noted virulently and openly racist U.S. Senator, Francis G. Newlands of Nevada, and there can be no doubt that Newlands, in choosing the others who would serve on the Board of his Club, chose only those who shared his racist prejudices.

    The initial Board was the body vested with the power to admit members: applicants who were “one of us”; people with whom the Board members socialized and knew well, and who no doubt shared these prejudices.

    Americans accustomed to the rapid pace of change in the US don’t realize the institutionalized resistance to change, extending over decades, that characterizes country clubs. Each one is a local “House of Lords” of heredity privilege and conservatism. Because membership in such a club is central to the sense of prestige and superiority that members cherish, once someone became a member, he (it was always “he” until a few decades ago when women were allowed to join in their own right) would never resign. Indeed, perpetuation of ancient attitudes is reinforced by policies in which persons who have been members for, say, 50 years, are released from the obligation to pay dues. Retired from their board rooms and law firms, for them, the club becomes their focus of attention, a place where they can preserve the kind of world they grew up in; a world where African-Americans exist to deliver drinks and meals to the tables.

    There was no need for bylaws to state a bar against African-Americans. Rules that required letters of support from a certain number of current members (today at Chevy Chase Club, 14 different members) to bring prospective new members forward provided a defacto exclusionary rule. The current members simply were not the sort of people who would ever get to know any African-Americans well enough to want to sponsor one.

    The racial attitudes of the older generation in power in the 1950s did not change when the Supreme Court said that the Constitution required integrated schools. Some of the private schools attended at that time by the children and grandchildren of members undertook efforts to integrate. St. Albans, in Washington D.C., my school (1973), which was also my father’s school (1950), admitted its first African-American student the same year as Brown; Sidwell Friends, my mother’s school (1952), did the same about a decade later.

    The leadership on racial matters was provided by the headmasters of these schools, who were education professionals and religious leaders who came from outside the clubby world of alumni-dominated boards, and who pushed their boards to integrate. It did not find a counterpart in the leadership of the clubs.

    By the early 1970s, when my own class at St. Albans was about 10% African-American, and when the president of the student body, Randall Kennedy (now a noted professor at the Harvard Law School) was African-American, the membership of the Club was still lily-white. It was impossible to know if there might be one or two African-American members. Certainly none of the photos in the club bulletins of the children who played in the tennis or golf tournaments included anyone other than whites.

    Almost 40 years later, nothing has really changed. And if left to themselves, these clubs will never change. The reactionary “House of Lords” mentality of the older generation filters out dissenters of the younger generations, and ensures that only those members of the new generation who accept the attitudes of the old rise to positions of power.

    The progressive integration of more and more institutions of society signals an increasingly great disconnect between the clubs and the rest of society. It tells our children that in school they are in an integrated environment, but when they cross the boundary line onto the grounds of a club, they enter a whites-only environment. For their parents to be members, and yet condone this, tells the next generation that we, their parents, feel a segregated environment is OK.

    For governments to permit golf courses that are, in effect, segregated plantations in the midst of fancy neighborhoods, sends an unacceptable signal to everyone who drives past these large reserved tracts of racially-exclusive land. When I see Tiger Woods take a swing on the course of one of these clubs, I wonder: Does he realize the symbolic sense of what he is doing?

    Country clubs such as Chevy Chase Club are institutions of exclusion and segregation whose time has passed. No longer do they serve as magnets to increase the value of newly-developed land. Instead, now they are obstacles to the integration of society as a whole. The leaders of these clubs, through their political donations and social positions, wield tremendous power in county and state politics. So meaningful change is unlikely to come about without federal action.

    There is little hope that these clubs can ever meaningfully reform themselves from within, without significant outside pressure. The larger community can and should take action. I propose an increase in real estate taxes commensurate with the value of the land if it were turned into de-segregated residential or commercial use. The Department of Housing and Urban Development should institute a program whereby it calculates the total taxes from real estate value, sales revenue, and other sources that a city or county would generate if a private club or golf-course were instead developed similarly to the land-use patterns around it, such as residential or retail use. The amount of various federal grants and subsidies to the relevant city, county, or state could then be reduced by that amount. Federal aid to local government could then be freed to aid neighborhoods that need it far more.

    And those communities that condone the continued operation of defacto segregated leisure plantations would have to face the financial implications of allowing prejudiced institutions to continue to operate as if still in the world of a racially-prejudiced past.

    Edward Sisson is a Washington, D.C., lawyer and cultural commentator.

  • Cash, Not Pretense: An Entrepreneur’s Guide to the Credit Crisis.

    Compared with most businessmen, 41-year-old Charlie Wilson has some reason to like the economic downturn. President of Salvex, a Houston-based salvage firm he founded in 2002, Wilson has seen huge growth in the bankruptcy business over the past year. It is keeping his 10-person staff, and his 55 agents around the world, busy.

    But the credit crunch still creates headaches for Wilson. With loans hard to secure, many would-be customers cannot bid on the merchandise in his inventory. “We are booming with more deals because people are defaulting,” Wilson notes, “but the buyers are gun-shy because they can’t get the money to pay.”

    So what do you do in these circumstances? Charlie Wilson is taking a back-to-basics approach. Rule No. 1: Stay away from people who rely on credit, not cash. This means private companies – including many outside the U.S. – are often better customers than larger, but now cash-strapped, public ones. “The further away I get from Wall Street, the better I feel,” Wilson says.

    Cheap is the new hip. Focus on cutting costs and streamlining operations. Don’t spend money on unnecessary employees or hard infrastructure; use the Internet wherever possible. It helps, Wilson says, to be located in an affordable building and in a place, like Houston, where taxes, regulatory costs and rents are generally cheap. “I work out of a Class C building,” he says, “and now everyone thinks it’s sexy.”

    Expand your range of customers. Look for new customers who have cash resources and access to markets that are still growing. This has led Wilson to look outside the U.S, to places like India or China, where many companies still have cash and see the current crisis as a great opportunity for bargain hunting.

    These three trends – the growing importance of cash, cost cutting and expanding one’s customer base – are defining entrepreneurial response to the credit crash. All three trends can be seen in the strategies of entrepreneurs who are focusing on burgeoning, often cash-oriented immigrant markets.

    Consider the success of La Gran Plaza, a massive Latino-themed shopping center on the outskirts of Ft. Worth, Texas. Not so long ago, La Gran Plaza was a failing suburban shopping center. Now it’s thriving, but only after being regeared to service the cash economy of the local Latino community. Similar success can be seen elsewhere in the country, even in Southern California, which has been hard-hit by the recession but where ethnic malls and supermarkets continue to thrive.

    Some urbanists, like scholar Richard Florida, maintain that the post-crash environment favors densely populated (and very expensive) cities like New York. But in fact, it may make more sense for entrepreneurs concerned with costs to work out of places like Houston, or even the Great Plains states, where local governments are more business-friendly. And everything, from housing to energy, tends to be less expensive.

    Indeed, over the past few recessions, the basic pattern has been that cities come into the downturns late and stay in them longer. In the last decade, many big cities have become very dependent on Wall Street and asset inflation. In 2006, for instance, financial services accounted for a remarkable 35% of all of New York City’s wages and salaries, compared with less than 20% 30 years earlier.

    So it seems likely that the credit crisis will hit pretty hard in those places most addicted to credit – places like New York, San Francisco and Chicago. This occurred early 1980s, the early 1990s and will occur again now. It might even be worse this time around. The federal takeover of the banks will mean lower salaries and bonuses, which will make such places less attractive to ambitious young people. If you are limited to $250,000 a year, it’s much easier to “get by” in Charlotte or Des Moines than it is in Manhattan.

    The biggest hope for New York, Los Angeles and other big cities lies with immigrants and the fact that lower property prices could keep some talented individuals from migrating elsewhere. But the one expensive big city really well-positioned for the credit crunch may be Washington, D.C., since it “creates” its own credit. As key financial decision making shifts to the capital, we can expect to see some financial-industry titans (and their retainers) spending more time in, or even moving to, the capitol. Washington, it’s time for your close-up.

    Beyond the beltway, the credit crunch will eventually benefit places with lower costs of living – including Houston. High rents, strong regulatory restraints and prestige spending make little sense in a cash-short environment. Now, fancy high-rise offices in elite areas are an albatross for even the strongest business.

    The remade economy may hold some much-needed good news for hard-hit sun-belt markets. Some places, like Phoenix, may be poised for a comeback. “Phoenix is paying for being overbuilt, but [lower] prices will attract people back,” explains local economist Elliot Pollack. “The fundamentals that drove the growth are still here with the return of lower costs – the ease of doing business, lower taxes and the attractiveness of the area.”

    But the real winners may be the people now leaving big companies to start new firms. Unburdened by bad habits developed in the bubble, they will be able to fit their business models in lean times. Many won’t mind being in an un-fancy building or neighborhood. Whether they are forming new banks, energy companies or design firms, they will need to do it more efficiently – with less overhead, smarter use of the Web and less pretension.

    “People are watching their companies go under. You get three vice-presidents who get laid off but know their business,” Wilson says. “They start a new company somewhere cheap that is more efficient and streamlined. These are the companies that will survive and grow the next economy.”

    This article originally appeared at Forbes.

    Joel Kotkin is executive editor of NewGeography.com and is a presidential fellow in urban futures at Chapman University. He is author of The City: A Global History and is finishing a book on the American future.

  • Chevy Chase Circle Fountain: A Call To Rededicate A Memorial To Racism

    On the 200th anniversary of the birth of Abraham Lincoln, C-SPAN watchers nationwide saw an especially poignant symbolic moment. Assembled on the floor of the Capitol Rotunda, along with House and Senate members, were hundreds of guests. Behind every speaker stood the marble statue of Abraham Lincoln, bending benignly, holding in his outstretched hand a folded Emancipation Proclamation.

    When the speaker’s spot was taken by the current occupant of Lincoln’s office — a black man, an African-American — President Obama spoke in honor of the Great Emancipator. The fruition of Lincoln’s sacrifice stood, proven and achieved, before the statue of the murdered President.

    Symbols — statues, plaques — matter. Sprinkled about our cities, they come into being as the result of contemporary interests and priorities. But who can tell, as time flows on, whether history will welcome their enduring presence, or wish to wipe them out?

    One such memorial that ought to be wiped out is a monument to a man who stood against everything Lincoln stood for. It is a memorial that disgraces the City of Washington, the capitol of the nation: A memorial fountain that honors the perniciously racist U.S. Senator Francis G. Newlands. The current Majority Leader of the Senate, Harry Reid – who was on the speaker’s platform at the celebration, and who spoke after President Obama did – holds the seat that Newlands once held.

    The fountain, built and dedicated in the mid-1930s, is not located in some obscure spot where few stumble upon it. No, it is positioned at one of the major commuter entrances to the City, right at the border, on Connecticut Avenue at Chevy Chase Circle. I live not far away, and I know that every day, tens of thousands of people see it; not only commuters, but those who come into the city from Interstate 95 and the Beltway.

    The circle is an urban design whose symbolic function is to create a visual focal-point. Those entering or leaving the City must make-way, defer, bend aside to accommodate whatever the planners of the city choose to place there. This particular circle is one of only four circular entrances into the Capital. One of those circles honors Lincoln. Another honors Robert F. Kennedy. A third is vacant. And the fourth honors the racist Newlands.

    Newlands was a U.S. Senator who died in office in 1917. He openly called, as late as 1912, for amending the constitution to strip the vote from African-Americans. His segregated land development plans established a precedent for segregated suburbs that spread across America. He openly called for African-American education to be limited to education for domestic and menial work. A leading contemporary African-American newspaper editor put Newlands on the same lowest level of dishonor as “Pitchfork” Ben Tillman of South Carolina and “Great White Chief” Jim Vardeman of Mississippi. But Newlands, who as a young man started his career in California and was elected from Nevada, could not even make the feeble excuse, as they might have, of being the product of a people historically conditioned to race prejudice.

    Newlands’ race bigotry was the product of greed and ambition, not upbringing, and it encompassed animosity towards Asians and everyone else not of the white race. He saw racism as a means of winning votes, and of making money. Lots of money.

    Anyone who looks at urban residential patterns sees the de facto racial segregation of neighborhoods. But only students of the history of urban and suburban development recognize that these segregated patterns were not the result of mere happenstance.

    In the decades after the Civil War, the newly-freed slaves may nominally have held legal rights, but whites still held all the money and all the land. Before Newlands began his political career, he was the manager and trustee of a vast fortune made by his wife’s family in western gold and silver, and he used that fortune to buy vast tracts of what is now the northwest section of Washington D.C.

    In the 1880s and 1890s, Rock Creek Park was set-aside, nominally as a region of recreation, but also as a barrier to racial integration. East of the park might be integrated, but not West. From Florida Avenue north, Connecticut Avenue and the neighborhoods surrounding it are all Newlands’ creation, all the way past the District Line several miles into Maryland. Newlands instituted racist policies over all this land, including at the fancy Chevy Chase Club which he founded and of which he was the first President. (Chief Justice Roberts recently joined that racially-insensitive institution, and I see it as a telling “freudian slip” that Roberts would strike the one false note at the historic inauguration’s key moment.)

    The Newlands’ land extended west all the way to Wisconsin Avenue. Today, anyone can log-on to Google Earth and see the line of expensive shops along the east side of Wisconsin Avenue, north of Western Avenue. Those shops – promoted by the still-operating company that Newlands founded, the Chevy Chase Land Company – call themselves the “Rodeo Drive” of the East Coast.

    The land under every single one of those shops would be owned by African-Americans, and not by Newlands’ legacy company, were it not for Newlands’ racism. In 1909, when Newlands discovered that the sub-developer to whom he had sold the land intended to develop it as residences for African-Americans, Newlands sued the developer for fraud and got the land back. Rather than let African-Americans live near whites, the company left the land largely unused for almost 100 years.

    Newlands’ segregated approach became a model for racist land development nationwide. White Americans who look with fear on the poverty and danger of many African-American urban neighborhoods can blame developers like Newlands and his progeny, who, by creating white enclaves, necessarily also created black enclaves.

    The fountain at Chevy Chase Circle is the legacy of Newlands’ land development efforts. His widow paid for it, and her friends lobbied for it. It was not the work of anyone from Nevada who might have wanted to honor their Senator. It was merely an effort to beautify a suburban development. No one knew in the mid-1930s that Connecticut Avenue would become a major thoroughfare into the City.

    To honor Lincoln and Robert Kennedy, city planners may justly ask the citizens to “bend aside” at a traffic circle, but not to honor Newlands. We are fortunate that the memorial is not a statue, but a fountain. A statue cannot be renamed; it looks like the person it originally honored. But a fountain can be renamed with the stroke of a pen and the replacement of a plaque. The Chevy Chase Circle fountain instead should honor one or more notable and historically significant African-Americans whose lives stand for the achievement of equal rights and for human dignity for all.

    The matter should ultimately be in the hands of the people’s elected officials. But I have proposed that a woman born enslaved in the District, who attained a college degree and became a leading educator – Fanny Muriel Jackson Coppin – should be one person honored. Another should be, not the obvious choice of Frederick Douglass (who is already honored in several places), but his oldest son, Lewis Henry Douglass, who was a heroic sergeant in the Colored Troops who fought in the battle immortalized in the motion picture Glory, and who, as a legislator for the District during the short-lived period of Reconstruction, authored the District’s first anti-discrimination law.

    When Congress restructured the District government and abolished the seat Lewis Douglass once held, the new government conveniently “forgot” Douglass’ anti-discrimination law, by leaving it out of the statute-books. But in the 1950s a diligent researcher re-discovered the law. The DC prosecutor applied it, and the Supreme Court affirmed it.

    The racism of Newlands, however conveniently hidden, has also been rediscovered. A people that has just elected the first African-American US President should no longer need to suffer this embarrassment. Action is necessary to strike Senator Francis G. Newlands from the roster of Americans honored in our capital city.

    Edward Hawkins Sisson is a Washington D.C.-based attorney. See The Chevy Chase Fountain for an album of photographs and documents. Selected Sisson papers available at the Social Science Research Network (SSRN).

  • A Washington, D.C. Arts & Innovation District: “Sonya’s Neighborhood”

    A recent widely-read piece in the Washington Post, “The Height of Power,” noted the great prospects of Washington’s rise to the top, not only in politics but in publishing, media, business and the arts. In this way, it said, Washington’s evolution will follow the pattern of other great capitals like London, New York, Paris or Tokyo.

    As a seventh-generation Washingtonian, born here and baptized in the National Cathedral, this is a prediction I am delighted to hear. I spent almost ten years producing avant garde experimental theater in the US and on tour in Europe, but I was based in San Francisco, not in Washington; my Washington artistic presence consisted of my last production, Actual Shō, playing the Kennedy Center Opera House in 1988. As an MIT bachelor of science graduate (in architecture), I know and greatly appreciate the spirit of innovation and experimentation that is at the core of America’s entrepreneurial, adventurous approach to life.

    There are many reasons why America needs Washington to enter the first rank of innovative cultural centers. Dearest to me is that playwrights, screenwriters, novelists, and all the artists who take on the portrayals of politicians, politics, and power will become part of the same milieu as the political leaders. The result will be that members of each group develop a more sophisticated understanding of the other.

    The key to transforming Washington into a center of cultural and scientific innovation is to establish a stimulating neighborhood, such as New York city’s SoHo/Tribeca, that attracts creative people who cross-fertilize each other, and who become part of the everyday social circle both of the political leadership and of the city’s African-American core community.

    Where should Washington build the creative, innovative neighborhood it needs to accomplish this? I know just the place: A parcel of some 100 acres, now occupied by wholesale grocery and souvenir warehouses, light industry, a federal Park Service truck maintenance yard, and little-used, dilapidated municipal facilities. Its bare, windswept hilltop is the last unoccupied “commanding height” in the city. It doesn’t have any residences (and thus no residents to oppose the project), yet it’s within just a mile of the Capitol Dome.

    I’m a member of a family that has been present in Washington for more than 200 years. Our family lands included this property, which was a large woodland estate, started in about 1800. It included all the land west of today’s Gallaudet University to the railroad tracks (plus some land on the other side of the tracks), north of Florida Avenue, and, on the north, included not only the ground on which today New York Avenue lies, but also the railroad yards north of New York Avenue.

    Just south of New York Avenue, the land rises steeply to a hilltop, and then falls away gently. This hilltop is now home to a National Park Service maintenance yard and the Brentwood Reservoir, but from about 1811 to 1915 it was the site of a mansion built by Congressman Joseph Pearson (Federalist – NC) for his second wife, Eleanor, daughter of the first mayor of Washington, Robert Brent. From the 1820s through the 1880s the Brentwood Mansion was a social center of Washington, scene of many a dinner and ball as horse-drawn carriages conveyed the wealthy and powerful up the hill, through the well-kept forest to the mansion. For aficionados of Jane Austen’s Pride and Prejudice, it was the closest thing Washington ever had to the fictional Pemberly of Mr. Darcy – and it was built in precisely the era of Jane Austen. Now the site is strewn with rusting machine parts and Park Service dumpsters. Sic transit gloria mundi (“so passes worldly glory”).

    As the city grew it surrounded the estate, but the estate itself was never developed. The city took pieces of it, built New York Avenue over part of it, and put railroad tracks on one side. As the city developed, the isolated, aging mansion never gained access to modern utilities, and the family moved away and neglected it. Eventually, in the early 1920s, my grandfather developed a wholesale food market and managed the land until his death in 1948. One of his brothers died in 1951; a third lived far away; the fourth tried to manage the property from his home in Connecticut but gave up and sold it all.

    This large parcel that once was our family land is now again in disrepair. The city government and owners of various pieces of it are hoping to develop it: the usual mix of office-buildings and townhouses, with no particular theme or vision of a unique, exciting neighborhood.

    What I propose is to develop this entire large area – not just the parts subject to the present plans, but almost all of the former family property, including the mix of federal and DC-government land – as a neighborhood specifically dedicated to be stimulating and exciting for creative people. The property offers an ideal place to create an “arts and innovation district,” a kind of SoHo or San Francisco in DC. It’s large, contiguous, and self-contained. It already has an institution of higher learning, Gallaudet, along one side, and a Metro stop at one corner.

    Since the property is south of New York Avenue, I think of it as SoNYA = Sonya = “Sonya’s Neighborhood,” which sets the tone for the concept as personal and human, rather than the bureaucratic feel of calling it a “district” or “zone.” This large-scale project would be a major job-generator, exactly in-line with the new Stimulus Bill, and the existing federal and DC-government ownership means that it is an ideal public-works project for President Obama and Mayor Adrian Fenty to promote.

    The fact that the site includes a prominent hilltop gives the project a glittering opportunity to achieve instant national and international status. If you fly into Washington, you will see a prominent hilltop gothic cathedral, the National Cathedral. It symbolizes the importance of religion in American life. And, of course, anyone coming to Washington sees the Capitol Dome, which symbolizes democratic government, and sees the monuments to the Presidents – Washington, Lincoln, Jefferson – that symbolize the importance of history.

    The hilltop where the family mansion stood is a place where Presidents, Senators, Cabinet Members, Justices, and Representatives dined, drank, and danced long ago. It should now be the site of a highly-visible, signature building of innovative design to serve as an Arts & Innovation Center. The ground is at an elevation of 175 feet above sea level. Any tall building placed on this “commanding height” not only will have commanding views down across the city, it will also “be seen” from many places around the city, as are the National Cathedral, the Capitol, and the Washington Monument. This prominent building will symbolize the importance to America of innovation and creativity. As core tenants, I propose the federal agencies the National Endowment for the Arts and the National Endowment for the Humanities, who would move their headquarters from the Old Post Office. The building could also house a Washington branch of the new Singularity University based in Silicon Valley (see http://singularityu.org/.)

    This building would serve as the keynote for the entire development, which would spread-out to the south on the slope below it, down towards Florida Ave. “Sonya’s Neighborhood” should be mixed-use, residential and office, with the ambience of New York’s SoHo or of San Francisco’s denser neighborhoods, and a feel similar to Venice, Italy – lots of narrow pedestrian-only streets, with bistros, art galleries, clubs, etc. – a place where creative people like to hang out.

    A local surface transit system can connect from the Metro stop through all of the development up to the hilltop Arts & Innovation Center building. It could extend into the Gallaudet campus, and to the nearby Ivy City neighborhood as it is redeveloped.

    There is much more to the proposal, including relocation of the grocery and souvenir wholesalers, and the Park Service maintenance facilities, to a new facility built overtop of the railroad yard north of New York Avenue (as in Manhattan, where Park Avenue is built overtop of railroad lines running to Grand Central Terminal). I encourage anyone who is interested to contact me via e-mail at sissoed@hotmail.com (no “n” in “sissoed”) to learn more.

    Edward Sisson is a Washington D.C.-based attorney. If there is sufficient interest in developing the Arts & Innovation Building and Sonya’s Neighborhood, he expects to take a leading role as “producer” of that exciting project, utilizing his unique background in Washington, in architecture, in the arts and the sciences, and in law to solve the many hurdles and obstacles that will confront the project.